December 4, 2025
In a Nutshell
- Building off of our recent report on property tax limitations in Michigan, we examined tax base changes across different types of local governments from 2004 to 2020 and found very limited growth largely due to the effects of the Great Recession and the assessment limit instituted by Proposal A.
- The greatest tax base growth is evident in communities that have land to develop and a growing population; communities without developable land available are limited in the growth of their tax base and must raise tax rates to increase revenue.
- Continuing to develop new land is not sustainable as developable land is a finite resource. Local governments need tax options that can grow with their economy without adding new development or continually raising property tax rates.
Last year, the Citizens Research Council did a deep dive into the impacts of Michigan’s unique combination of property tax limitations on taxpayers and local government finances. Our report found that local government tax revenue growth is severely constrained by these limitations, unless a community is able to tap into new development to grow its tax base. Because of these growth constraints, many communities are only able to respond to public service demands by increasing their property tax rate. Something that is not sustainable over the long haul.
Using our earlier report as a springboard, we turned our attention to examine more closely the observed tax base changes across different types of local governments to suss out how the tax limitations operate across varied dimensions. Our broad review found limited tax base growth over the period from 2004 to 2020 largely due to the effects of the Great Recession and the assessment limit instituted by Proposal A.
The data below shows that the perspective of local government officials may vary widely based on the type of government they represent and the geographic location of that government. The greatest growth is seen in communities that have land to develop and are growing in population, i.e., townships and communities in western or northern Michigan.
Change in taxable value from 2004 to 2020
With adoption of Proposal A in 1994, property taxes are no longer levied on the state equalized value (SEV) of a parcel of property, which fluctuates with the market. Instead, tax levies are based on the taxable value (TV) with yearly increases for each parcel of property restricted to the lesser of five percent or the rate of inflation (excluding the value of new construction). When a property is sold, its value for tax purposes reverts to market value (SEV) and future annual changes to TV are then capped once again with the new owner. To better understand what has happened to the tax base over the period, we looked at how TV has changed from 2004 to 2020 in counties, cities, and townships across the state.
TV growth was generally slow. Total county TV grew 24.2 percent over the 16-year period with only a 1.4 percent annual rate of growth. Wayne County lost TV, falling from $45.9 billion in 2004 to $44.2 billion in 2020, a 3.58 percent loss (-0.24 percent annually). Outside of Wayne County, annual growth varied from 0.05 percent in Genesee County to 4.35 percent in Gratiot County.
Changes in TV 2004-2020
(dollars in billions)
| 2004 TV | 2020 TV | Total Change | Annual Change | |
| Counties | $304.7 | $378.4 | 24.19% | 1.36% |
| Cities | $135.2 | $142.3 | 5.24% | 0.32% |
| Townships | $168.0 | $233.6 | 39.08% | 2.08% |
Source: Michigan Department of Treasury, CRC calculations
The map below shows that Livingston and Oscoda counties (colored white) had annual rates of growth equal to the average rate of inflation over the period (1.99 percent). The tan counties, primarily found in the eastern part of the state, had annual rates of growth below inflation; the teal counties, largely in western and northern Michigan, had annual rates of growth greater than inflation.
Annual TV Growth by County
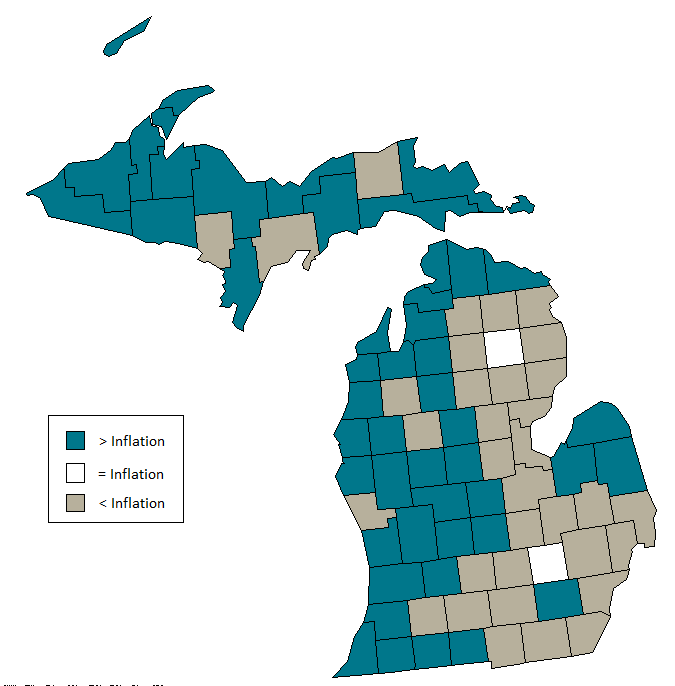
Source: Michigan Department of Treasury, CRC calculations
Growth in TV was even more stagnant in cities, with the total TV of all cities growing only 5.24 percent in 16 years (0.32 percent annually). Change varies from a decrease of 58.56 percent, or 5.36 percent per year, in Ecorse (Wayne County) to an increase of 110.76 percent, or 4.77 percent per year, in Zeeland (Ottawa County). In 57 counties, the cities experienced an increase in TV on average; in the remaining 15 counties, the constituent cities experienced a decline in TV from 2004 to 2020. Those counties (Calhoun, Cass, Crawford, Genesee, Hillsdale, Huron, Jackson, Macomb, Monroe, Oakland, Osceola, St. Clair, Schoolcraft, Tuscola, and Wayne) are generally rural and/or Southeast Michigan counties. (Eleven counties do not have any cities.)
The greatest growth, on average, was experienced in townships. Total township TV grew from $168.0 billion in 2004 to $233.6 billion in 2020 (39.08 percent or 2.08 percent annually). Change ranges from a decline of 50.82 percent (-4.34 percent per year) in Indianfields Township (Tuscola County) to an increase of 473.9 percent (11.54 percent per year) in Chandler Township (Huron County). None of the counties have negative average growth across their townships; average growth ranges from 18.6 percent to 138.7 percent.
TV growth is highest in communities growing in population and new development
The map that highlights where TV growth has exceeded inflation and where it has been below inflation reflects what the data told us in the property tax limitations report. That report found that townships and exurbs with land to develop and growing populations saw the most property tax revenue growth even with tax limitations because they had new development and that led to TV growth and more revenue.
When we look at all local governments, growth in TV has been highest in townships and West and Northern Michigan. These are the areas that have been leading the state in population growth and generally have more land to develop. Communities like Southeast Michigan that are made up of more built-out cities and suburbs have seen less TV growth. Some local governments in Southeast Michigan (e.g., Wayne County) still have TVs that are below what they were in 2004. It is important to note that the averages mask variations across regions; some communities in Southeast Michigan have experienced TV growth over the period while others in West Michigan have experienced decline or slow growth.
Despite average yearly growth above inflation in several regions, TV growth statewide has been slow, growing 24.19 percent from $304.7 billion in 2004 to $378.4 billion in 2020. The statewide average yearly growth rate of TV is just 1.36 percent, below an average inflation rate of 1.99 percent. This slow growth is due in large part to the Great Recession, which impacted property values across the state, but devastated them in Southeast Michigan.
Conclusion
Local governments with new development, like many townships and communities in West Michigan, have seen the most TV growth and, therefore, the most potential for property tax revenue growth without raising tax rates over the period. This is not sustainable over the long run though because those growing communities will become built-out at some point. Developable land is a finite resource and continuing to push development out promotes urban sprawl. Communities need ways to increase their tax bases without new development or raising tax rates. One option is expanding diverse tax options for local governments, or expanding state revenue sharing, and ending local governments’ almost complete reliance on the property tax.
Permission to reprint this blog post in whole or in part is hereby granted, provided that the Citizens Research Council of Michigan is properly cited.
