


September 29, 2026
In a Nutshell
- FBI data shows that from 2020 to 2024 larceny thefts in Detroit have increased by 33 percent, while motor vehicle thefts have increased by 44 percent.
- Generally, property crime has been on the decline in Detroit and its peer cities since 1990. However, Detroit’s motor vehicle theft rate continues to be the highest among six peer cities in 2024. Detroit larceny theft rate was higher than four of six peer cities but has tended to be in the middle range among peers historically.
- The Research Council recommends that the Sheffield Administration focus on addressing the social determinants of crime, which include poverty, income inequality, and unemployment, based on our analysis and existing crime research. Effective policy solutions include anti-poverty programs, workforce development, and blight reduction. Recent announcements by the Sheffield Administration suggest a deterrence strategy through enhanced street lighting and a new property crime squad.
Detroiters continue to call for more to be done to combat crime in the city. In a 2025 survey from the Detroit Metro Area Communities Study (DMACS), Detroiters reported that crime and safety should be a high priority for Mayor Mary Sheffield.
Crime has two major dimensions: violent crime and property crime. Property crime includes arson, burglary, robbery, motor vehicle theft, and larceny. Property crime in the U.S. is much more common than violent crime. Larceny theft is the most reported type of property crime followed by motor vehicle theft and burglary.
A 2021 survey of Detroit residents’ views on crime and policing found that crime concerns remain prevalent. More than one-quarter of residents reported they had been the victim of a crime in 2021, but fewer residents were experiencing property crime compared to 2019. In January 2026, Mayor Sheffield announced reductions in all categories of major crimes, including robbery, auto theft, and carjacking. Nationwide, 2025 property crimes are down from 2024, according to the Federal Bureau of Investigation’s (FBI) 2025 Crime Data.
During her State of the City address, Mayor Mary Sheffield stated that property crime was a concern among residents and businesses and a priority for her administration. She directed the Detroit Police Department (DPD) to create a “Property Crime Squad” in all 12 city precincts. She also called for police to be more visible and present in neighborhoods across the city. This was coupled with her “Brighten Up the Block Plan” program to install 3,000 streetlights to enhance neighborhood safety. Also of note, several initiatives of the Mayor’s 6-Point Community Safety Plan address property crime.
Even before Mayor Sheffield took office, the city prioritized tackling property crime. While there is no specific allocation for fighting property crime in the city’s budget, the city’s budgets historically devote the largest share of general fund resources to the police department. Most cities spend a considerable portion of their General Fund budgets on policing. Existing programs for property crime reduction, created during the Duggan Administration, include Project Greenlight created in 2016, a partnership between the city, community groups, and businesses to allow DPD to use clearly marked surveillance monitors at gas stations, liquor stores, and restaurants across the city.
The Duggan Administration attempted to tackle property crime through its blight removal program. According to city press releases, Detroit demolished 26,978 structures through city initiatives funded through the Hardest Hit Fund and Proposal N bond proceeds. Residents who live in blighted neighborhoods reported lower neighborhood satisfaction and perceived safety. A study of Detroit’s demolitions found a statistically significant relationship with demolitions and reduced property crime.
The prioritization by residents on fighting crime, the numerous programs to enhance public safety, and the considerable allocation of taxpayer funds to policing underscores the need to examine another layer of Detroit crime as a major public policy issue and identify the policy options that can sustain Detroit’s continued revitalization.
Beyond the focus on public safety and programs intended to curb crime and create a greater sense of safety, Detroit should focus on addressing social determinants of crime, including addressing poverty, income inequality, and unemployment that create incentives for the gains from property crime and address social cohesion and social control in neighborhoods that can prevent crime from thriving. Addressing these social determinants will pay long-term dividends to enhance the quality of life for Detroiters beyond simply reducing the property crime rate in the city. This is the Research Council’s third report in a series about crime in Detroit and across peer cities. Future reports will examine the public safety budget, juvenile crime, and differences in crime rates across the state, metro area, and neighborhood-level.
Background
Property crime as defined by the FBI Uniform Crime Reporting (UCR) includes burglary, larceny-theft, motor vehicle theft, and arson. Property crime involves the taking of money or property from a victim without force or the presence of a threat of force against a victim. Violent crime, in contrast, includes offenses that involve force or threat of force (e.g., murder, rape, robbery, and assault). The FBI UCR collects data on both property crime and violent crime from federal, state, county, tribal, university and college law enforcements agencies. However, the annual data from the FBI only captures reported crimes; while we know some crimes go unreported, those occurrences cannot be quantified. Similar to the FBI data reporting, conventional classifications of crime from criminology include: 1) violent crime, 2) property crime, and 3) public order offenses, or victimless crimes.
Larceny-theft is defined by the FBI as the “unlawful taking, carrying, leading, or riding away of property from the possession or constructive possession of another.” It differs from burglary which is characterized as “unlawful entry of a structure to commit a felony or theft.” Larceny differs from robbery as robberies are characterized by threat of force or use of force.
Motor vehicle theft is the “theft or attempted theft of a motor vehicle.” Motor vehicle theft differs from carjacking, a violent crime, which involves taking another’s motor vehicle with the intent to “cause serious bodily harm or death by force, violence, or intimation.”
Social Determinants of Property Crime
Many studies link property crime with poverty and income inequality. Rational choice theory asserts poverty can change an individual’s expected costs and benefits for criminal activity. Strain theory suggests that societal pressures and inequality of opportunity can cause strain on an individual and can lead to criminal offending behavior. In the context of absolute poverty, income being below a specific level, and relative poverty, income being low in relation to some reference group, property crimes are more likely to occur in response to economic stressors and perceived inequality.
Unemployment also is linked to property crime and is more strongly linked to non-violent crime than violent crime. A 2001 study using state-level data found unemployment to be a strong predictor of property crime controlling for state-level demographics and economic factors. The effect of unemployment is also grounded in rational choice theory. Loss of earnings and expected income increases the expected benefits of criminal activity.
Social disorganization in neighborhoods or the breakdown of family structure and stability of a community also is a predictor of property crime. Social disorganization relates to such factors as socioeconomic status, physical disorder, informal social control, and mutual trust in a particular place, neighborhood, or street. A neighborhood experiencing social disorganization is characterized by poor economic conditions, population turnover, and mixture of different racial groups. A 2009 study of social disorganization and crime in Seattle found that street blocks experiencing social disorganization such as low property values, public housing, and physical disorder experienced higher rates of crime.
Other factors associated with property crime include age, policing, law enforcement, and family and community structure. No single social determinant or social factor can explain all the variation in property crime rates.
Trend and Peer City Comparisons
We examined trends in property crime in Detroit and peer cities using FBI data on larceny-theft and motor vehicle theft from 1990 to 2024. Given that population varies across cities, we calculated a crime rate per 100,000 population for both larcenies and motor vehicle theft for Detroit and peer cities, so we can accurately compare property crime across cities.
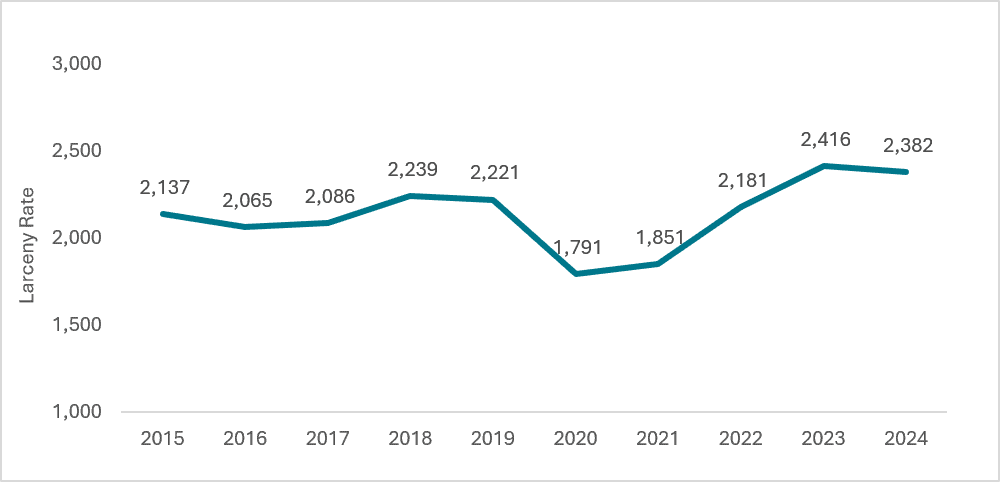
Detroit’s larceny rate has been steadily increasing since 2020. The larceny theft had fallen dramatically during the Covid pandemic in 2020 and steadily increased until 2024. As of 2024, Detroit larceny rate is finally on the decline at a rate of 2,382 larcenies per 100,000 people, a 33 percent increase from its low in 2020 (see Chart 1). Assuming little-to-no population growth in 2025, Detroit’s larceny rate is expected to decline.
Chart 1
Detroit Larcenies Per 100,000 People, 2015 to 2024
Source: FBI Uniform Crime Reporting; U.S. Census Bureau Population Estimates Program
We used larceny and motor vehicle theft data from the FBI UCR program and calculated crime rates using population data from the U.S. Census. The collected data was used to analyze recent crime rates in Detroit and its six peer cities, as well as compare rates over time.
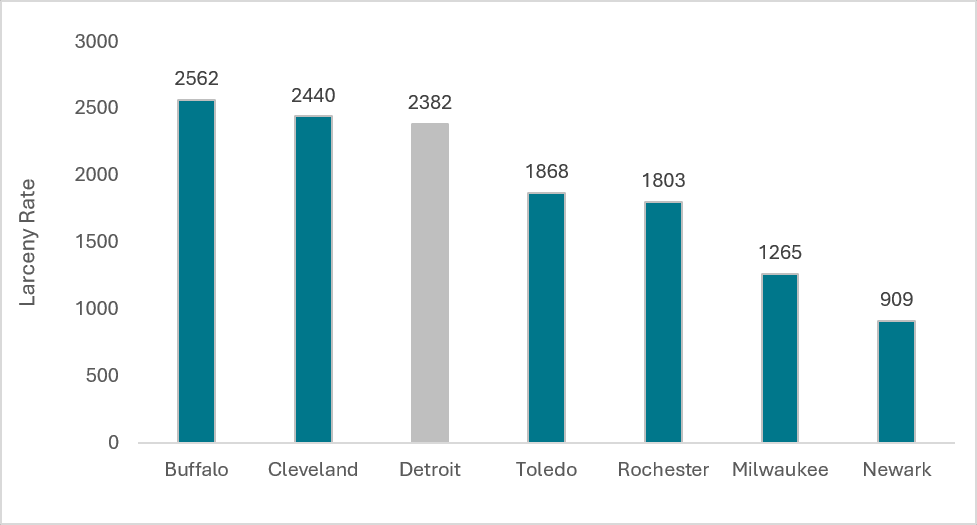
While it is good news that Detroit’s larceny rate is recently on the decline, benchmarking the Detroit larceny rate to other peer cities reveals that there is more work to be done. Detroit’s larceny rate is the third highest among six peer cities with similar social and demographic characteristics (see Chart 2). Detroit’s larceny rate is comparable to Buffalo and Cleveland that have at least 2,300 larcenies per 100,000 people but higher than Toledo, Rochester, Milwaukee, and Newark that all have at least 20 percent fewer larcenies than Detroit.
Chart 2
2024 Larcenies per 100,000 People, Detroit and Peer Cities
Source: FBI Uniform Crime Reporting; U.S. Census Bureau Population Estimates Program
Detroit’s larceny rate has been declining over time, following a similar trajectory to its peer cities (see Chart 3). As of 2024, Detroit’s larceny rate was 2,382 larcenies per 100,000 people, a 40 percent decline from its 1990 larceny rate.
Detroit has historically been in the middle of the pack with regards to its larceny rate compared to peer cities. In 1990, Rochester, Toledo, Milwaukee, and Newark all had larceny rates that exceeded Detroit’s (see Chart 3). In 2010, Detroit’s larceny rate was exceeded by Buffalo, Cleveland, Rochester, and Milwaukee.
Chart 3
Larcenies Per 100,000 People for Detroit and Peer Cities, 1990 to 2024
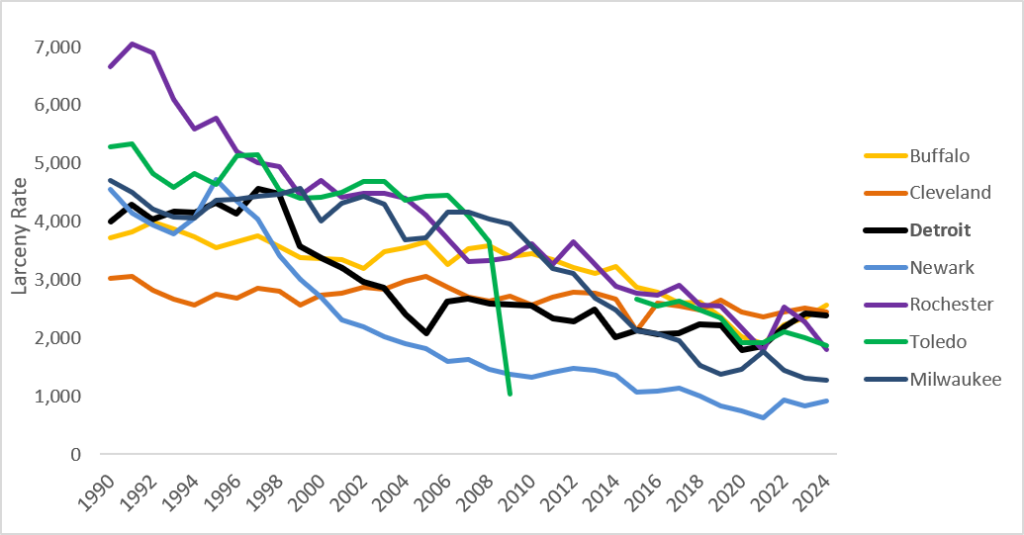
Note: The Toledo Police Department did not report any larcenies from 2010 to 2012 as well as 2014, based on FBI data. This is likely due to the police agency not reporting the data to the FBI, a recurring issue with FBI crime data submissions from local police agencies.
Source: FBI Uniform Crime Reporting; U.S. Census Bureau Population Estimates Program; 1990 Census of Population1
However, Detroit’s larceny rate has been climbing in the last five years, eclipsing other peer cities. In 2020, Detroit had a larceny rate of 1,791 larcenies per 100,000, a rate that was lower than most peer cities. However, Detroit’s larceny rate increased by 33 percent from 2020 to 2024. Many peer cities like Newark, Rochester, Toledo, and Milwaukee are overtaking Detroit with lower rates under 2,000 larcenies per 100,000 people in 2024.
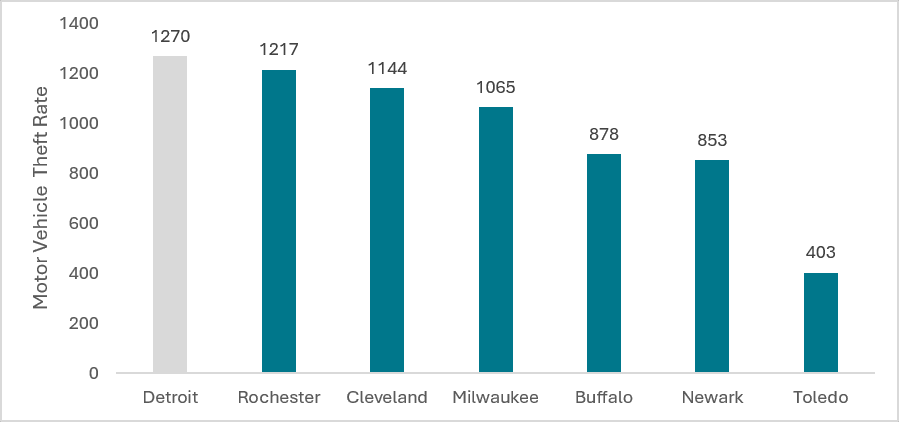
Detroit has the highest motor vehicle theft rate among peer cities. Detroit’s motor vehicle theft rate is 1,270 motor vehicles thefts per 100,000 people, according to 2024 crime data. Detroit’s rate is comparable to cities like Rochester, Cleveland, and Milwaukee, who all have at least 1,000 thefts per 100,000 people (see Chart 4) in 2024. Buffalo, Newark, and Toledo had rates of motor vehicle theft under 1,000 thefts per 100,000 people. Toledo had the lowest motor vehicle theft rate among peer cities of 403 thefts per 100,000 people.
Chart 4
Motor Vehicle Thefts Per 100,000 People for Detroit and Peer Cities, 2024
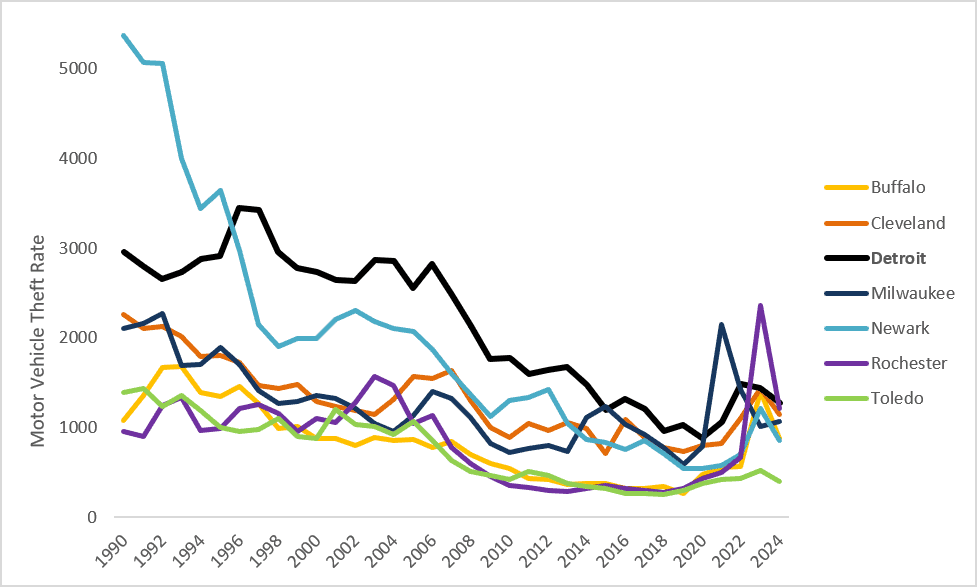
Historically, Detroit has had the highest motor vehicle theft rates among peer cities since 1996. Between 1996 and 2020, Detroit had the highest rate of motor vehicles thefts among peer cities (see Chart 5). Prior to 1996, Newark had a higher theft rate than Detroit with more than 3,000 motor vehicle thefts per 100,000 people. In recent years, Detroit’s motor vehicle theft rate was overtaken by Milwaukee in 2021 with a rate of 2,150 thefts per 100,000 people and Rochester in 2023 with a rate of 2,360 thefts per 100,000 people. However, in 2024, Detroit’s motor vehicle theft rate once again eclipsed all other peer cities. While Detroit once again has the highest rate of motor vehicle thefts, the Detroit motor vehicle rate is 57 percent lower than its 1990 rate of 2,955 motor vehicle thefts per 100,000 people.
Chart 5
Motor Vehicle Thefts Per 100,000 People for Detroit and Peer Cities, 1990 to 2024
Source: FBI Uniform Crime Reporting; U.S. Census Bureau Population Estimates Program;1990 Census of Population
Since 2020, Detroit motor vehicle thefts have been steadily increasing. In 2024, Detroit had 1,270 motor vehicle thefts per 100,000, an increase of 44 percent since 2020. From 2020 to 2024, Detroit’s motor vehicle theft rate was the highest among peer cities and was only eclipsed by Milwaukee in 2021 and Rochester in 2023. Detroit’s motor vehicle theft rate peaked in 2022 at 1,490 motor vehicle thefts per 100,000 people and declined by 14 percent in 2024.
Discussion
Detroit has much lower property crimes than it did in 1990, but property crime has been increasing in recent years and is at levels that are higher than other peer cities. While Detroit did not have the highest rate of larceny theft among its peer cities in 2024, the larceny rate was similar to Cleveland and Rochester, peer cities with the highest rates of larceny theft of at least 2,000 larceny thefts per 100,000 people. Detroit has historically been plagued by higher rates of motor vehicle theft than peer cities as well. While motor vehicle theft is down from all-time highs in the 1990s, Detroit still has the highest rate of motor vehicle theft among peer cities.
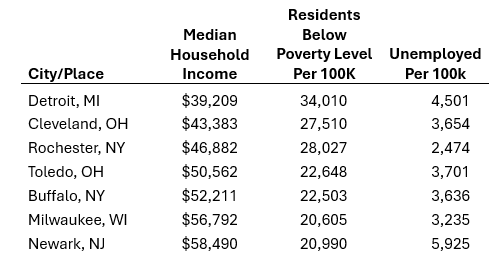
Social determinants of property crime include poverty, income inequality, and unemployment. Among peer cities, Detroit has both the lowest median household income and the highest share of residents living in poverty (see Table 1). Detroit also had the second highest unemployment rate among peer cities as well. These conditions add fuel to the fire by making the propensity for property crime much more likely through economic strain on Detroiters and/or by making property crime more attractive than legal employment. These economic headwinds also stress social cohesion in neighborhoods. Any progress towards a safer Detroit will need to address root causes of crime by reducing poverty, inequality, and other economic strains. While not exhaustive, we propose several ways Detroit can tackle these social determinants of property crime.
Table 1
Poverty Indicators and Unemployment in Peer Cities, 2024
Property crime in Detroit can be addressed at its root by addressing poverty and income inequality within the city and within individual neighborhoods. As discussed by the Urban Institute, urban blight increases crime through “cycles of disinvestment” resulting in population loss and the erosion of the economic and tax base. Strategies to address blight include code enforcement, demolitions, stabilizing housing markets, home repair, and large-scale revitalization and redevelopment. As discussed earlier, the Duggan Administration had launched major initiatives fighting urban blight in Detroit. However, it must be noted that local governments lack the resources to fully address urban blight.
Fighting unemployment is also another lever by which property crime can be addressed. One study suggests that “employment-based anticrime policies” can be effective tools for combating crime, especially in areas with high concentration of jobless workers. Detroit supports workforce development through its workforce agency, Detroit at Work, through job fairs, job training programs, classes, and partnerships with employers.
Economic strain on Detroiters is also a function of the overall state of the U.S. economy. As we discussed in a prior paper, Detroit’s economy is resilient with steady gains in employment, wages, and household income being forecasted. However, wage inequality between the average wages at Detroit firms and Detroit residents’ average wages remain a persistent problem. Closing that gap would not only support fighting wage inequality but also support crime prevention efforts by mitigating the effects of relative poverty and making criminal activity less attractive as compared to legitimate employment.
Studies have also shown that policing focused on community and problem-solving were effective at reducing crime as compared to “aggressive order maintenance” strategies. However, policing is a deterrence rather than a solution to the root causes of crime identified in research.
While major cities like Detroit devote a sizable portion of their budgets to policing, the evidence suggests that the Sheffield Administration must tackle the root causes of property crime which include poverty, income inequality, and unemployment as well as strengthen the social fabric of neighborhoods. There are signs that the mayor is taking this approach through her “holistic approach” to fighting crime that includes community violence intervention, poverty reduction, and the creation of an Office of Neighborhood and Community Safety. However, recent announcements at the State of the City suggest a crime deterrence strategy. Addressing social determinants of property crime is key to enhancing public safety in Detroit neighborhoods and stemming crime from the source.
- U.S. Census Bureau population estimates by year were not available for cities from 1990-1994. As a workaround, the city population for Detroit and peer cities from 1990 to 1994 was assumed to be the 1990 population from the 1990 Census of Population. ↩︎
