July 22, 2026
In a Nutshell
- Early literacy outcomes in Michigan reveal persistent challenges for students from low-income households. State assessment data consistently show that children from underserved households are less likely to meet third grade reading benchmarks than their more affluent peers, reflecting both opportunity gaps and broader socioeconomic disparities.
- As part of its policy response to flagging reading scores, Michigan has more than doubled its annual investment in “at-risk” student funding, bringing the total to more than $1 billion for the upcoming 2025-26 school year. Districts are obligated to use these funds, in part, to address the needs of struggling readers and publicly report on their progress.
- While it may be too early yet to tell, our analysis of districts’ “at-risk” student reading proficiency rates since the end of the COVID-19 pandemic suggests that state funding enhancements may be beginning to pay dividends in districts that receive greater per-student resources under the state’s new Opportunity Index funding formula.
As summer slips into fall, public K-12 schools across Michigan are welcoming students back for a new school year. With it comes a mix of excitement, challenges, and opportunities for students, families, and teachers. But the new year also shines a renewed light on important and persistent challenges facing the state’s public schools and their efforts to prepare students for future K-12 academic success and ready them for college and/or careers.
Early literacy is one of the stubborn student learning challenges that has garnered significant state-level policy attention and increased public investments in recent years. Early literacy is widely recognized as a foundational skill for future academic achievement and lifelong learning. While Michigan student test scores in several other grades and subjects have shown important (albeit gradual) improvements since the COVID-19 pandemic, third and fourth grade reading proficiency rates continue to drop. A reminder of this concerning trend was brought to light recently when the Michigan Department Education released Spring 2025 statewide assessment results showing that fewer than four in ten third graders tested proficient in reading.
Early literacy outcomes in Michigan reveal persistent challenges for Black students and those from low-income households. State assessment data consistently show that children from underserved households are less likely to meet third grade reading benchmarks than their more affluent peers, reflecting both opportunity gaps and broader socioeconomic disparities. These differences emerge early and often compound over time, limiting students’ ability to succeed in later grades.
Understanding the scope and nature of these challenges is central to evaluating Michigan’s current policies and state investments intended to better support early literacy development among underserved students. To this end, this report begins with a high-level summary of the early literacy challenges facing the state’s low-income students as documented through state assessment performance. It notes some of the state’s recent policy responses, including the sizeable new investments in supplemental at-risk student funding with a major policy shift towards providing greater per-pupil funds to districts with higher concentrations of poverty. Finally, the report presents an original analysis using district-level at-risk student accountability data to examine districts’ recent progress (or lack thereof) towards improving their third grade reading proficiency rates.
By examining districts’ third grade reading progress since the 2021-22 school year, we explore whether the state’s increased financial investments into at-risk student funding and other early literacy initiatives are starting to pay dividends for Michigan’s low-income students. And, if so, which districts are making improvements.
Michigan’s Early Literacy Challenges and Policy Responses
Third grade reading proficiency is a critical benchmark in a child’s academic career. By the end of third grade, students transition from “learning to read” to “reading to learn.” This shift in learning underpins future academic success across many more subjects. Yet national data reveal that a significant portion of students fail to meet this benchmark, with profound long-term consequences for individuals and society.
This is true in Michigan, where just 40 percent of all third graders tested advanced or proficient or above in English language arts (reading) during the 2023-24 school year.1 That’s down from 41 percent the previous year and 45 percent in the last school year before the pandemic. Early literacy rates had been falling even before the COVID-19 pandemic disrupted public schooling, but widespread school closures and nearly year-long shifts to remote learning amplified Michigan’s longer-term trends. Since the pandemic, Michigan has had a much harder time than other states helping students recover in reading; it ranked 44th in K-12 student reading recovery between 2019 and 2024.
Of particular concern in the Mitten State are the socioeconomic and racial disparities in third grade reading proficiency rates among students. Just 27 percent of low-income third graders tested proficient on the 2023-24 state reading assessment compared to 57 percent of students from higher-income households. This disparity among student groups is long-standing as illustrated in Chart 1. Similarly, wide reading achievement gaps exist among Black students as just 17 percent of Black third graders tested proficient in reading. Michigan’s early literacy achievement gaps across household income status and race are some of the largest in the country. These alarming student results have prompted state policymakers to act on several fronts.
Chart1
Third Grade Reading Proficiency Rates, School Years 2015 to 2024

Source: MI School Data
Michigan has taken a multi-pronged approach to address early literacy gaps, especially for underserved students. At the state level, recent laws require dyslexia screening, evidence-based interventions, and teacher professional development in the Science of Reading. The Department of Education has also distributed over $87 million in grants for research-based instructional materials and training, while expanding teacher training in Language Essentials for Teachers of Reading and Spelling (LETRS) for thousands of K–5 teachers. Earlier policies, such as the Read by Grade Three law, created accountability structures for early identification and intervention. At the same time, Michigan has expanded access to high-quality preschool through the long-standing Great Start Readiness Program and the nascent universal PreK initiative, with the goal of reducing readiness gaps before children enter kindergarten. For its efforts in this space, Michigan has been recognized by education policy researchers as one of just 12 states with a “comprehensive” early literacy policy.
In addition to state funding directed at specific early literacy programs and initiatives, policymakers have made major investments to support the added learning needs of students deemed “at-risk” of academic failure. The state identifies students as at-risk and eligible for supplemental services if they meet one or more state-specified risk factors (e.g., low family income, academic risk indicator, English learner) under Section 31a of the School Aid Act. Section 31a funds must be used for instructional and direct non-instructional services and programs serving these pupils with the goal of improving proficiency on state assessments, including third grade reading.
Since Fiscal Year (FY)2022, the state has more than doubled its annual investment in at-risk student funding, bringing the total to more than $1 billion for the upcoming 2025-26 school year (see Chart 2). As a result of these investments, districts will, on average, receive nearly $1,500 for each at-risk student they serve in the coming school year. (Note: about 50 percent of the state’s 1.4 million K-12 students qualify for these supplemental state dollars.)
Chart 2
History of State At-Risk Student Funding
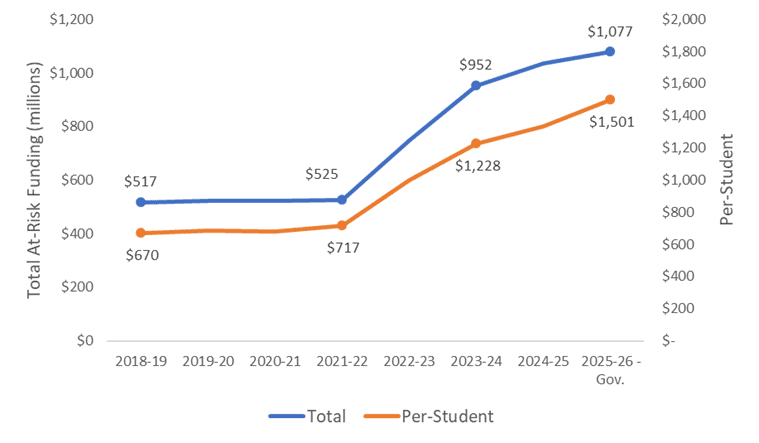
Source: Michigan Senate Fiscal Agency, Citizens Research Council calculations
Additionally, beginning in FY2023, lawmakers adopted the Opportunity Index to distribute state at-risk funds based on districts’ concentrations of low-income students. This new distribution formula provides higher-poverty districts with greater per-pupil resources in recognition of the compounding negative impacts that poverty concentration has on student learning outcomes in schools and districts. The index is designed to drive greater per-pupil funding to districts with the greatest needs (as measured by student poverty). For the current 2025-26 school year, we estimate that the Opportunity Index will provide high-poverty districts with $1,800 per-qualified pupil, compared to $1,300 per-pupil in low-poverty districts.2 Adoption of the Opportunity Index represents a major policy shift towards greater equity-driven funding for districts, with the goal of supporting learning improvements, including third grade reading proficiency, for low-income students.
Accountability for At-Risk Student Performance and Funding
Michigan holds school districts accountable for third grade reading improvements through a mix of assessment, intervention, and funding requirements. State law requires K–3 students to be screened at least three times per year using approved literacy tools, with individualized reading intervention plans for those who are behind. Progress is measured through the statewide assessment results (M-STEP) and district-level literacy reports, which factor into Michigan’s statewide accountability system. While the state repealed mandatory third grade retention for non-proficient readers in 2023, the “Read by Grade Three” law still obligates districts to provide early identification, evidence-based supports, and ongoing monitoring for struggling readers.
To keep the public, local schools, and state policymakers informed about district-level performance for struggling readers, the state maintains accountability reports and dashboards for its statewide School Index system. Additionally, Michigan has a separate system to track the progress of at-risk students and the supplemental funding that state provides to districts to serve them.
Unlike Michigan’s federally-required statewide accountability system (School Index) that rates schools across multiple indicators – student proficiency and growth on state tests, high school graduation, English Learner progress, and measures of school quality/student success (e.g., chronic absenteeism) – accountability for districts’ use of at-risk state funds is much more narrow. Specifically, Sec. 31a of the annual School Aid budget hold districts accountable for ensuring at-risk students attend school regularly and improve student proficiency rates on state assessments. Although the state has provided at-risk student funding since the adoption of Proposal A in the mid-1990s, it did not tie the use of this funding to specific student outcomes until about ten years ago. Beginning with the FY2015 School Aid budget, Sec. 31a has held districts accountable for improvements in at-risk student third grade reading proficiency.
To provide insights into districts’ progress improving early literacy with at-risk student funding, we analyzed changes in third grade reading proficiency rates across school districts based on their Opportunity Index grouping (i.e., district poverty concentration).3 This way of grouping districts allows for comparisons of at-risk student performance within similarly situated districts, rather than looking at the performance of all at-risk students collectively. Research shows that the concentration of poverty in a school influences student achievement more than the poverty status of an individual student or their family background, prior achievement, race, and gender. One study looking at school-level economic characteristics found that the relationship between greater poverty and worse achievement was twice as large in medium- to high-poverty schools as in low- to medium-poverty schools.
Using Michigan’s At-Risk Student Accountability dataset, we examined district-level reading proficiency rates to see how well districts are serving at-risk students.4 We looked for improvement in third grade proficiency rates over the post-pandemic period of state testing (2021-22 to 2023-24). This period overlaps with the state’s heightened focus on early literacy, increased state investments in at-risk student funding, and the implementation of the Opportunity Index to drive greater per-student funding to districts experiencing higher concentrations of student poverty.
Because Michigan’s 800-plus local school districts (traditional public and charter public) had widely different 2021-22 third grade reading proficiency rates, our analysis is focused on rate “improvement” over the two-year period. (Note: Proficiency rates for at-risk students ranged from over 80 percent to a low of six percent across the districts analyzed.) This allowed us to see if a district’s at-risk student reading proficiency rate in the 2023-24 school year is higher than it was in the 2021-22 school year. This approach is consistent with the state’s accountability measure (i.e., student proficiency) tied to the use of at-risk student funds.
Our analysis begins with a look at changes in at-risk student third grade reading proficiency rates over the two-year period using a “box-and-whisker” plot for each grouping of districts (i.e., high-, medium-, and low-poverty). This method of data presentation is a useful way to show patterns in student achievement by highlighting both median district performance and the range/distribution of outcomes across district groupings. Each plot in Chart 3 illustrates the median district performance for that group (i.e., line inside each box), the spread of most districts’ results (i.e., box represents the range of performance of middle 50 percent of districts), and whether there are large numbers of districts performing far above or below the majority (i.e., horizontal lines represent minimum and maximum).
Chart 3
At-Risk Student Third Grade Reading Proficiency Rates, by District Poverty Level


Source: Center for Educational Performance Information, at-risk student accountability data; Citizens Research Council calculations
In the context of early literacy, such plots can reveal whether state improvement efforts are lifting all districts or if progress is concentrated among higher-achieving districts. Presenting data this way provides a valuable tool for policymakers to assess not only whether reading proficiency rates are rising overall, but also how equitably those gains are distributed across districts with different poverty concentrations.
Not surprisingly, median district reading proficiency rates vary with levels of district poverty. In the 2021-22 school year, high-poverty districts had the lowest median rate (19.2 percent) and low-poverty districts had the highest median rate (42.5 percent), with medium-poverty districts’ falling in between (32.4 percent). This pattern holds for the 2023-24 median proficiency rates as well; high-poverty districts had a median rate of 19.0 percent, followed by medium-poverty districts at 30.0 percent, and low-poverty districts at 38.7 percent. These trends are not surprising given previous research that shows schools with high concentrations of students in poverty face additional challenges. These include funding inequities; teachers with less experience, less education and poorer evaluations; higher rates of teacher turnover; high numbers of students dealing with the impacts and stressors of poverty, requiring more teacher and staff support in the classroom; and increased exposure to environmental hazards and safety concerns.
Because this analysis is focused on how proficiency rates have changed over time, each district grouping’s 2021-22 rates are plotted side-by-side against the 2023-24 rates. With this objective in mind, we observe that all groupings of districts experienced a reduction in their proficiency rates over the two-year period, but some more so than others. Visually, this is observed in the plots by comparing how the median proficiency rate (i.e., line inside each box) in each grouping drops from one year to the next. In addition to the median rate, the plots also show that proficiency rates for the middle 50 percent of districts in each grouping dropped. This is represented by the fact that the shaded box in each plot is lower in 2023-24 school year than it was for the 2021-22 school year.
In terms of changes over time, the median at-risk student proficiency rate for high-poverty districts barely changed over the two-year period, falling from 19.2 percent to 19.0 percent. The decline was larger for medium-poverty districts; the median district proficiency rate fell from 32.4 percent to 30 percent over the two-year period. For the low-poverty district group, the median proficiency rate dropped from 42.5 percent to 38.7 percent.
After comparing the changes in the third grade reading proficiency rates for each district grouping (based on student poverty concentration), we examined individual districts to determine how many showed rate “improvement” over the two-year period. Of all school districts that reported at-risk student third grade proficiency rate data for both 2021-22 and 2023-24 school years, we show that less than one-half (42 percent) saw their proficiency rate increase over the period. This suggests that nearly 60 percent of districts failed to meet the state’s narrow objective of improving at-risk students’ early reading skills.
But there was considerable variation in at-risk student reading improvement across district groupings. For example, one-half of all high-poverty districts increased reading proficiency rates for their students over the two-year period. This compares to 40 percent for the medium-poverty district grouping and 37 percent for the low-poverty district group (see Chart 4).
Chart 4
Districts Showing At-Risk Student Third Grade Reading Improvement, 2022 to 2024

Source: Center for Educational Performance Information, at-risk student accountability data; CRC calculations
This suggests that high-poverty districts, as a group, had relatively more success improving at-risk students’ third grade reading proficiency rates than the other two groupings of districts. But it also must be noted that high-poverty districts generally had the lowest proficiency rates starting out (i.e., median proficiency rate of 19.2 percent in 2021-22). In other words, this group had the most ground to cover in meeting the needs of their students. Still, these measured improvements, even from a low starting point, represent progress for several districts serving high concentrations of low-income students. Clearly, additional progress is needed to more fully meet the learning needs of ALL at-risk students.
In addition to examining district-level outcomes, our analysis explored the number of at-risk students enrolled in the school districts showing early reading improvements over the two-year period. This is important because districts vary in student enrollment size, as well as the number of at-risk students enrolled. As shown in Chart 5, less than one-half (45 percent) of all at-risk students statewide attended a district that showed an increase in its third grade reading proficiency rate. But again, there was variation across groupings of districts based on the level of student poverty. For example, 63 percent of all at-risk students attending high-poverty districts were enrolled in a district that showed improvement in third grade reading proficiency rate. This compares with 39 percent of all at-risk students enrolled and attending low-poverty districts. Although 50 percent of high-poverty districts showed improvements in their third grade reading proficiency rate, these districts enrolled nearly two-thirds of all at-risk students attending the state’s high-poverty districts. This disparity is because several of these districts enroll large numbers of at-risk students, including Detroit, Saginaw, Jackson, and Lansing.
Chart 5
At-Risk Student Enrollment in Districts Showing Third Grade Reading Improvement
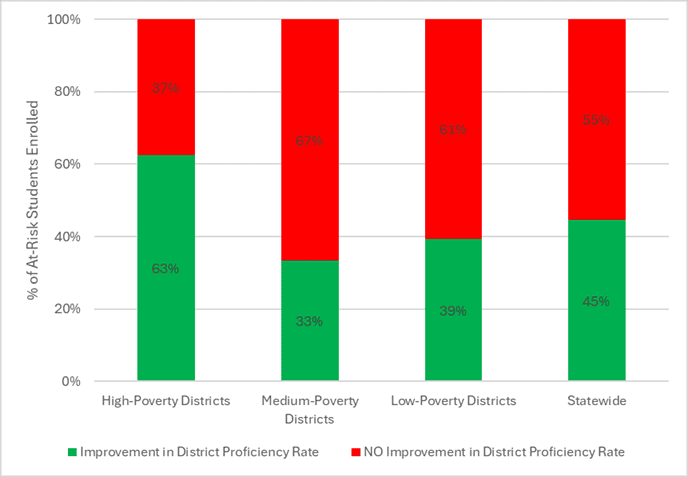
Source: Center for Educational Performance Information, at-risk student accountability data; CRC calculations
Notably, the relative success of high-poverty districts vis-à-vis medium- and low-poverty districts comes against a backdrop of heightened state policy attention to early literacy. As discussed earlier, one policy response has been to increase state investments in at-risk student funding and to adopt the Opportunity Index to drive more financial resources to districts that have the most struggling students, such as high poverty districts. While it may be too early yet to tell, our analysis suggests that these recent funding enhancements may be beginning to pay dividends in districts that have received greater per-student funding via the Opportunity Index formula. In fact, recent news reporting suggests that several districts across Michigan attributed their success in raising reading proficiency rates for low-income students, in part, to increased state funding.
Conclusion
Michigan’s efforts to improve early literacy among low-income students with increased funding and accountability measures are not showing the hoped for results. While some of the state’s most-recent responses to flagging reading scores, including marquee “science of reading” legislation passed in 2024, will not be fully implemented for a couple more years, the state has more than doubled funding for at-risk students since 2022 with a goal of improving early literacy. The state holds districts accountable for the use of at-risk dollars by tracking how well students are doing on annual third grade reading assessments. Our new analysis of at-risk student third grade reading results shows that fewer than one-half of all Michigan school districts showed improvement in “at-risk” student reading proficiency rates since the end of the COVID-19 pandemic. These district-level improvements, however, varied based on a district’s socioeconomic status; we found that 50 percent of high-poverty districts saw improvement in third grade reading proficiency rates among “at-risk” students, compared to just 37 percent of low-poverty districts.
Footnotes:
- The Opportunity Index divides the state’s school districts into six categories called bands based on the concentration of poverty – percentage of students from economically disadvantaged backgrounds – in the district. Districts with the highest concentration of poverty are in Opportunity Index band 6, and they receive the highest weighted funding. Currently, districts’ weighted per-pupil payments are pro-rated from the maximum allowed under the School Aid Act based on the total appropriation amount. ↩︎
- The Michigan Student Test of Educational Progress (M-STEP) measures Michigan students’ achievement in relation to the Michigan Academic Standards. M-STEP scale scores within each subject area can be described in ranges. The labels applied to these ranges are known as Performance Levels. The M-STEP performance levels are Not Proficient, Partially Proficient, Proficient, and Advanced. Students testing at the “Advanced” and “Proficient” levels are considered proficient when calculating “proficiency rates” for student groupings. ↩︎
- For this analysis, districts that fall into Opportunity Index bands 6 and 5 (at least 73 percent of district’s students are considered “economically disadvantaged”) are grouped together and considered “high-poverty”; bands 4 and 3 (44 percent to 73 percent of district’s students are considered “economically disadvantaged”) are considered “medium-poverty”; and bands 2 and 1 (up to 44 percent of district’s students are considered “economically disadvantaged”) are considered “low-poverty”. ↩︎
- District “proficiency rate” is defined as the percent of total “at-risk” students testing advanced/proficient on state third grade reading assessment. ↩︎
