
July 6, 2026
In a Nutshell:
- Comparisons to road funding levels in other states are frequently used to argue that Michigan road agencies are underfunded.
- When invoking such comparisons, a policy analyst must take care to assure that the data and methodology used can provide a reasonable and meaningful basis of comparison.
- The Citizens Research Council has constructed a Road Funding Index that compares revenue and expenditures for all 50 states across multiple variables. We find that over the decade including years 2012 through 2021, Michigan ranks 30th nationally and 7th in an 11 state peer group.
It is widely accepted that Michigan has long underfunded its public road network. This view is often supported by comparison to funding levels in other states. Such discussions often center around fuel tax rates, registration fees, or Michigan’s lack of tolled highways. Roads can also be funded through additional means such as “wheel fees,” property tax millages, and transfers from general funds.
The CRC has created a multifactorial Road Funding Index that combines all road and bridge revenue and expenditures reported by states to the Federal Highway Administration (FHWA) and U.S. Census Bureau. Using data from 2012 through 2021, we find that Michigan ranks 30th nationally in road funding, and 7th of 11 compared to peer states.
The Challenge of Comparative Road Funding Analysis
Does Michigan spend more on roads than Ohio?
This would seem to be a simple question with a clear answer. Yet attempting to answer this question requires entering a world of complex financial data and policy analysis.
According to U.S. Census data, Michigan road agencies spent $5.9 billion on road and bridge programs in 2021, while Ohio spent $6.0 billion. This would suggest that Ohio spent a bit more.
However, Ohio is a larger state than Michigan by number of residents. When this funding data is normalized to resident population, Michigan road agencies spent $5,810 per capita versus $5,098 in Ohio. This shows that on a per-capita basis, Michigan spent more on roads than Ohio in 2021.
But is per-capita expenditures the best way to evaluate road funding levels? Michigan is a geographically larger state. While Michigan’s resident population is 15 percent less than Ohio’s, the system mileage in the road networks is nearly equivalent. When evaluated by spending per mile, Ohio once again comes out on top.
In short, it matters how financial data is evaluated. Dividing expenditures by resident population versus system mileage can provide different results. Further, a single year of data does not account for the fact that road and bridge infrastructure investments typically have a life cycle of multiple decades. Even if two states are nearly equivalent in funding levels for a single year, that may not have been true in the recent past. The historically less-funded state may have a greater maintenance backlog and require more funding to achieve similar results.
Related, because construction costs can vary widely between states, reporting nominal dollars doesn’t reflect the actual purchasing power of the resources in each state. Available data suggests that $1 of construction spending in Ohio purchases about 25 percent more construction work than in Michigan. So even if both states are spending the same amount, Ohio is getting more ‘bang for the buck’ with each dollar expended.
There are multiple pitfalls when trying to compare road funding levels between states. We seek to provide an objective assessment of how Michigan ranks.
Generally, there are multiple pitfalls when trying to compare road funding levels between states. Yet such comparisons are frequently invoked during fiscal decision-making at the state and local level, including discussions around raising public dollars for road and bridge infrastructure.
For example, advocates for increased Michigan road funding contend that “every other Great Lakes state is investing $100 to $482 more per person in state routes than Michigan [in 2017].” This analysis does not account for the fact that Michigan’s “state routes” (those administered by MDOT) make up a smaller percentage of the statewide public road network than these other states. Thus, even if all Great Lakes states were spending the same amount per resident on the entire public road network, it would be expected that Michigan would be last when only “state routes” are considered. Further, road funding requirements are related to resident population only to the extent that population is related to system size and traffic demands. Thus, per-capita analyses provide questionable value to state road funding comparisons.
To better inform this discussion, the Citizens Research Council of Michigan has conducted an objective data-based analysis of state road and bridge funding levels to provide policymakers with an unbiased assessment of how Michigan ranks compared to other states.
A Novel Multifactorial State Road Funding Index
Our approach to comparing state funding levels combines multiple sources across ten years of reporting data for both state and local agencies, normalized in four different ways. The output is a novel “Road Funding Index” score that is abstract, but more meaningful than any other basis of comparison known to exist.
Data Sources
Financial data is reported in various ways, and different reporting methods capture different elements of road funding. We attempted to include a range of financial data categories to obtain a broad understanding of funding. Five categories of financial data were evaluated.
- “Revenues Used for Highways, All Levels of Government” is reported by state DOTs and includes revenues from federal, state, and local sources, including tolling revenue, bond receipts, property taxes, and transfers from general funds.
- “Total Disbursements for Highways, All Units of Government” data includes disbursements for highways, which may differ from revenues. Disbursements include capital outlays, maintenance and services, administration, and debt servicing. The original data table also included ‘law enforcement and safety;’ this line item was removed for our analysis.
- “Total Disbursements for Highways, All Units of Government, Capital Outlay” directly relates to expenditures on construction projects. While capital outlays were included in the previous category, we pulled this data out for individual evaluation.
- “Expenditures: Transportation: Highways” data is reported by state and local governments reflecting all expenditures on road and bridge programs.
- “Expenditures: Transportation: Highways: Capital Outlay” directly relates to expenditures on construction projects. While capital outlays were included in the previous category, we pulled this data out for individual evaluation.
Items 1-3 were obtained through the FHWA Highway Statistics Series tables. Items 4 and 5 were obtained through the U.S. Census Annual Survey of State and Local Government Finances. (Note that in funding policy, “highways,” refers to the entire public road system, not only expressways.)
Annual data for each of the five categories was collected from 2012 to 2021 – the most recent decade of available data. When combined together, these categories capture the revenues available to road agencies as well as the money disbursed or expended. Conducting analysis on a full decade of financial data accounts for variability in individual years and accounts for states that may have been historically lower funding. Financial data from the most recent three-year period (2019-2021) was analyzed with equal weight to the whole decade to obtain results that emphasize the most current financial data.
Correction for Construction Costs to Estimate Purchasing Power of Road Funding
Our recent analysis of highway construction cost inflation revealed that inflation rates vary widely across states. It stands to reason that this would also lead to wide variation in actual construction costs, and further research has confirmed this.
The FHWA estimates that the purchasing power of a nominal construction dollar on bridge work can vary widely across states. As state data is not readily available for pavement construction costs specifically, bridge costs were used as a proxy to estimate the purchasing power of all road and bridge construction and maintenance. Construction costs are compared to a hypothetical ‘typical state,’ which was set as a state with construction costs between the mean and median state.
Construction costs can vary widely across states. This must be considered when evaluating purchasing power of road funding levels.
Hawaii is the highest-cost state, where construction costs are about 640 percent that of a typical state. Hawaii is a significant outlier. Massachusetts, New Jersey, and Delaware are the next highest cost states, with construction costs ranging from 251 percent to 208 percent that of a typical state. Texas is the lowest-cost state, with construction costs of 31 percent of a typical state. This means that a nominal construction dollar expended in Texas has over three times the purchasing power of a typical state, and 20 times the purchasing power of Hawaii.
The result of this construction cost correction is an index that better reflects the ability of road agencies to build and maintain the road network within their individual budget constraints.
Normalization of Financial Data
An important step in analyzing financial data is deciding on a basis of comparison. For example, a geographically large but low-population state like North Dakota would rate very high in road spending per capita measures, but very low when state spending is evaluated per mile of road.
We’ve chosen four ways to normalize the financial data.
- Funding per centerline mile. Each financial data category was divided by the length of the statewide public road network in system miles reported in 2020. Centerline miles reflect the length of the road system, regardless of the number of lanes. This is a very common and meaningful way to evaluate road funding as the miles of road in a system directly relate to the cost of maintaining that system.
- Funding per lane mile plus bridge costs. For this method of evaluation, we used public road lane miles in each state in 2020. Further, we used the area of bridge deck in each state in 2020. Bridge area was converted to equivalent lane miles assuming 12-foot wide lanes. Using various data sources, we estimated that the annualized life-cycle cost of a bridge lane mile is six times the cost of pavement. Thus, for each state, the bridge area in lane miles was multiplied by five and added to the count of public road lane miles. This method of analysis accounts for the increased costs in states with a higher percentage of wide multiple-lane roads in the system, as well as states with an atypical number of bridges.
- Funding per Resident Population (per capita). While the resident population of a state does not directly impact road costs, dollars per capita is a common way of evaluating road funding. Each financial data category was divided by the resident population of each state in 2020.
- Funding per Truck Vehicle Miles Traveled. Truck traffic is a very important factor to consider when evaluating road funding, as trucks impose the vast majority of pavement damage. Each financial data category was divided by truck vehicle miles traveled (VMT) in 2020.
Each of the four denominators are evaluated independently, as well as combined into the final Road Funding Index score.
Findings
Our findings reflect both revenue and expenditure data for all road agencies within a state (including state DOTs, local road agencies, and tolling authorities). The financial data has been corrected for variable construction costs to obtain purchasing power. Because revenue and expenditures reflect different aspects of road funding, the financial data is abstracted into an index score that reflects the range of funding levels across states.
The tables below reflect the top and bottom five states, as well as Michigan and ten peer states we previously identified.
Funding per Centerline Mile
Our first component index score reflects purchasing power per centerline mile of all public roads within each state. Results are shown in Table 1, below.
Table 1
Funding per Centerline Mile Component Index Score and Rank
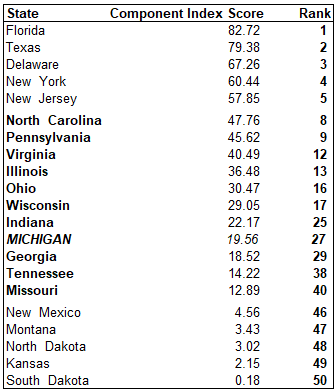
The amount of funding per centerline mile in Michigan ranks 27th nationally and 8th of 11 among peer states.
The top two states, Texas and Florida, have achieved this rank largely due to the construction cost correction method factored into the index score. Not only are these states reasonably well-funded, but they benefit from very low construction costs. If not cost-corrected, Texas and Florida would rank 14th and 9th respectively. Michigan has construction costs very near the typical state and would still rank 27th if not adjusted.
The lowest-ranked states tend to be geographically large, primarily rural states.
Funding per Lane-mile plus Bridge Costs
This method of analysis accounts for funding needs related to system size but not captured by funding per centerline mile. States that have a greater percentage of multi-lane roadways and bridges require more funding to construct and maintain that system.
Table 2
Funding per Lane-Mile plus Bridge Component Index Score and Rank
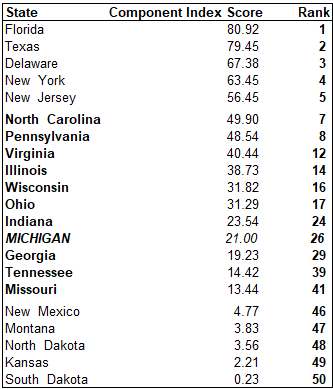
While multi-lane roads and numerous bridges can impose high costs on a state, the state rankings that consider these costs vary little from the centerline mile analysis. In most states, the centerline mileage of the entire public road network is so vast that the limited number of multi-lane roads and bridges have marginal impact on funding needs.
Michigan ranks 26th nationally in the amount of funding per lane-mile plus bridge costs and 8th of 11 among peer states, very similar to its ranking by centerline miles.
Funding per Resident Population
Evaluating funding per state resident population results in a much different rank order than when considering system size by mileage, as shown in Table 3.
Table 3
Funding per Capita Component Index Score and Rank
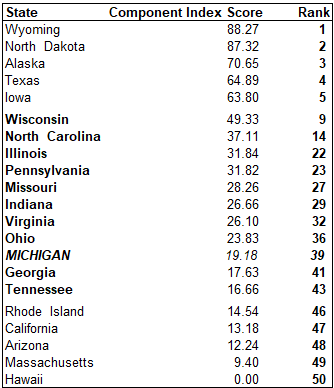
The highest-ranked states in funding per capita tend to be sparsely populated, large rural states.
As with our other analyses, these rankings reflect purchasing power rather than nominal dollars. For example, Texas (#1) and Iowa (#5) enjoy relatively low construction costs and would rank 17th and 10th, respectively, if not cost-corrected. Hawaii suffers the highest construction costs in the nation and would rank 42nd if not cost-corrected, but ranks 50th by our method.
When adjusting for construction costs to estimate purchasing power, Michigan ranks 39th nationally and 9th of 11 among peer states. Michigan would rank 43rd in funding per capita if not cost-corrected (8th of 11 among peer states).
Funding per Truck Vehicle Miles Traveled
Beyond system mileage, truck traffic is the most critical factor in evaluating road funding needs. Trucks impose the great majority of pavement damage and thus directly impact required maintenance costs.
Table 4
Funding per Truck VMT Component Index Score and Ranking
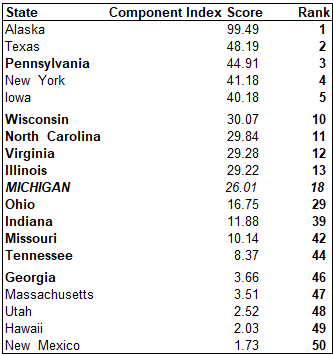
When evaluating funding per truck VMT, Alaska ranks #1, and is a significant outlier by the component index score, reflecting the relatively low amount of truck traffic seen in the state.
The rankings of funding per truck traffic often correlate with the rankings in funding per capita. This makes sense as much economic activity that requires commercial trucks is driven by a state’s population. Michigan, however, is an exception. As a peninsular state, Michigan is not subject to much of the pass-through inter-state truck traffic seen in other states. In fact, Michigan reports one of the lowest percentages of truck VMT in the nation (relative to all traffic within the state).
Michigan’s funding per truck VMT ranks 19th nationally and 6th of 11 among peer states.
Summary Road Funding Index Scores
The individual index scores provided in Tables 1-4 were combined and averaged to provide a summary Road Funding Index score (Table 5).
Table 5
Summary Road Funding Index Scores and Rankings
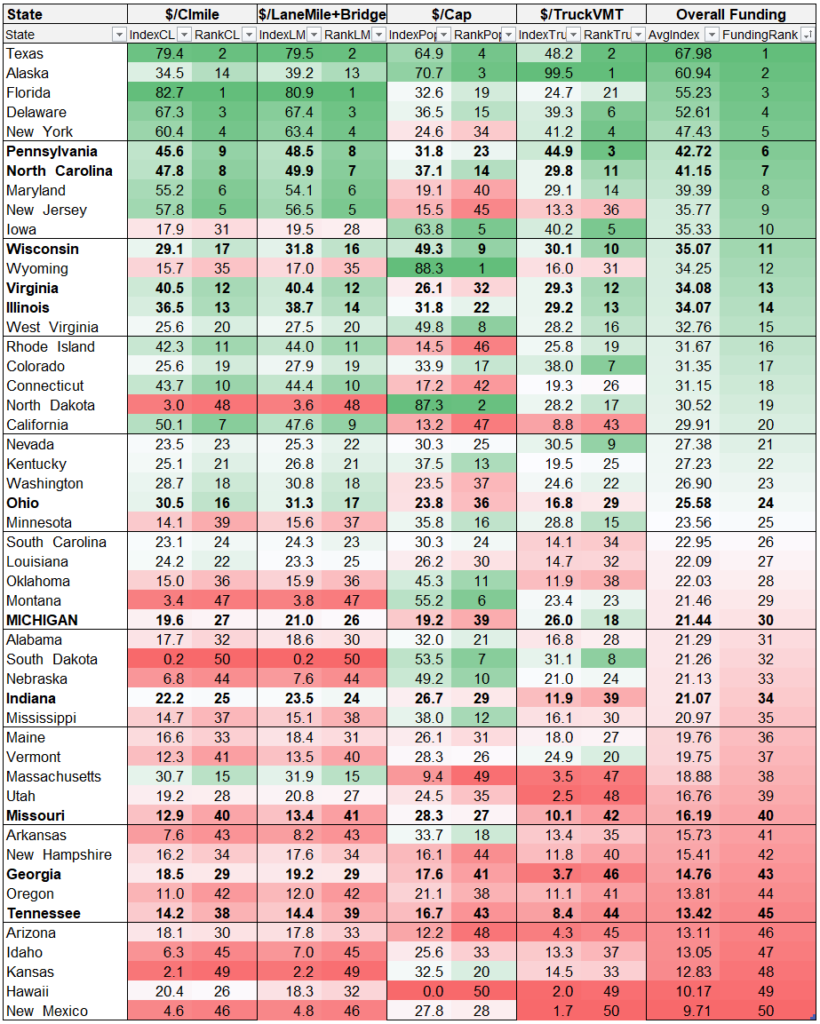
Table 5 provides a condensed understanding of funding levels in each state relative to four different bases of comparison. The color-coded table demonstrates the importance of choosing a denominator by which to compare funding levels, as several state rankings may vary substantially. The four individual index scores are simply averaged together to obtain the final summary Road Funding Index and ranking.
Michigan ranks 30th nationally and 7th of an 11 peer state group by the summary Index score. Over the most recent decade of financial data available, corrected for construction costs, our method shows that Michigan has significantly less road construction purchasing power than peer states of Pennsylvania, North Carolina, Virginia, and Illinois. Ohio is better-funded than Michigan, but less so than these other states.
Michigan’s road construction funding (purchasing power) ranks significantly above the peer states of Missouri, Georgia, and Tennessee. Michigan also ranks above Indiana, but the summary Index scores are nearly equivalent.
Caveats
Ideally, a comparative analysis of state financial data would use audited financial statements from each agency included in the evaluation. Unfortunately, collecting and interpreting data from all 50 state DOTs and local road agencies is impractical. We must rely on data that has been aggregated and reported at the national level.
Evaluating road funding financial data across states is a fraught endeavor. In reporting data to the FHWA and Census, agencies must reinterpret their internal financial structures to report data within a consistent nationwide reporting structure. This imposes data reliability issues as national data is subject to variations in state and local government reporting decisions made by individuals within each road agency. It is difficult to know to what extent any financial reporting metric provides an ‘apples to apples’ comparison.
It is because of this data reliability issue that our novel Road Funding Index pulls data from both FHWA and Census sources and includes five distinct financial reporting metrics. This method accounts for any potential differences in an individual data source and provides a broad account of financial reporting within each state.
Any investigations regarding road funding adequacy across all 50 states are bound to be incomplete.
The resulting index score is abstract, and subject to challenges relating to several methodological judgments. Nevertheless, we believe that the Road Funding Index presented here is the most robust approach to a state-by-state road funding financial analysis ever conducted. If the financial data collected annually by the FHWA and Census can tell us anything about comparative road funding levels across states, that information is captured by the Index.
There are also differences between states that cannot be captured by the data or chosen methodology. Potential factors that should be considered are briefly discussed below.
Historical Timeline
The Road Funding Index includes financial data from the years 2012 through 2021. As roads and bridges have a service life of multiple decades, the current financial adequacy of road funding may be impacted by funding levels of 30 years ago or more. Such historical data was not included in deriving the Index.
Data Normalization
As demonstrated, the results of a road funding financial analysis can be heavily affected by the basis of comparison. The Road Funding Index combines four bases of comparison equally weighted. The removal of any of these components would change the resulting Index score and state rankings. Financial data from 2012-2021 was normalized to data from the year 2020, and thus does not account for changes in system size, number of residents, or truck traffic across that decade.
Bridge Costs
Construction and maintenance of bridges can impose significant costs on a road agency. States with a relatively high number of bridges in the system likely require more funding to maintain the system in good repair. We have attempted to capture this variability by including the deck area of bridges in each state, converted to lane-miles, and assuming that a lane-mile of bridge imposes six times the annualized life cycle cost of a lane mile of pavement. However, there can be a wide variability in the life cycle cost of individual bridges. States like Pennsylvania, with multiple historical and landmark bridges, are likely subject to costs that are not captured by this method. Additionally, states such as New York and New Jersey have systems that include many tunnels, which have even higher costs than bridges and were not included in our method.
Bond Funding
Road agencies often expend money that has not yet been captured by revenues through bond-funded programs or projects. These bonds are often serviced over multiple decades, so a percentage of the revenue available to a road agency in any given year may be dedicated to debt servicing. The Road Funding Index embeds an assumption that the bond-funded revenue and revenue dedicated to debt servicing balance-out over the decade analyzed (2012-2021). This is likely not the case for many states.
Variable Construction Costs
A dollar of road funding can have vastly different purchasing power in any given state due to differences in road construction costs. Thus, states with equivalent funding levels may yet have different capacities to convert that dollar into road construction and maintenance activities. We have attempted to correct for these variable costs based on reported 2020 costs for bridge work through the National Bridge Inventory and extended the relative variation to all construction activities. This approach uses the best data known to be available but is of questionable applicability to the entire road network and does not account for variable inflation rates in each state over the decade analyzed.
Truck VMT
A controlling factor in road funding requirements is the truck traffic imposed on a system owned by a road agency, as truck load imposes more pavement damage than any other factor. We have attempted to capture this by including a $/TruckVMT component index. Yet, the available data only provides the VMT of commercial vehicles within each state, not the class of those vehicles or the loaded weights. Differences in truck load spectrum experienced by each state could imply different costs imposed by truck traffic that are not captured by our method. Michigan, for example, has unique truck weight regulations and may have a more challenging truck load spectrum than many other states.
Additional Variables
The United States is a large nation, and individual states are subject to various costs and constraints imposed by climate, geology, land-use patterns, or abrupt events such as hurricanes and volcanoes (i.e., Hawaii). As such, any investigations regarding the funding adequacy across all 50 states are bound to be incomplete. That said, we believe that the Road Funding Index represents the most comprehensive approach to comparing road funding levels across all 50 states that has ever been conducted. The comparison is made more relevant by comparing Michigan specifically to ten peer states.
Summary and Discussion
Michigan road agencies and the road construction industry often contend that Michigan has historically underfunded its roads. This argument is typically supported with limited data that pertain to a single year of analysis, using only one basis of comparison (e.g., per-capita).
Our Road Funding Index combines multiple sources across a decade to provide the most relevant information on comparative funding levels that can be derived from available data.
Using multiple road-funding metrics analyzed over the years 2012 through 2021, Michigan ranks 30th nationally and 7th of 11 compared to peer states.
Map
Color-coded Map Reflecting Road Funding Index Score by State (Ranking Shown for Michigan and Peer States)
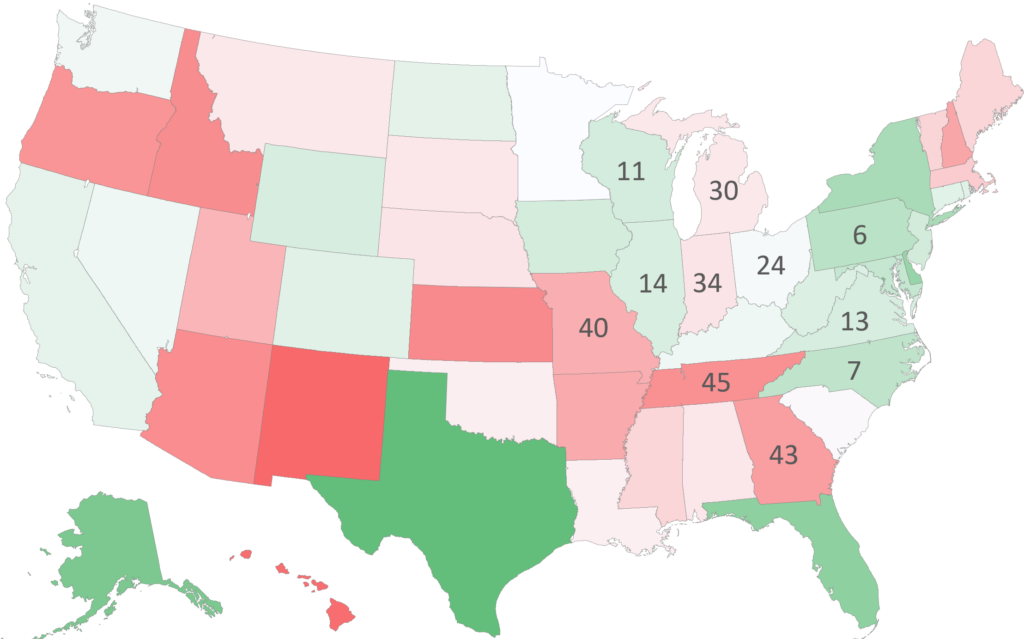
Of the individual indices, Michigan ranks highest in funding per truck traffic (18th), though this evaluation may not capture costs imposed by Michigan’s unique truck load spectrum. Michigan ranks lowest in funding per capita (39th); this is unsurprising as Michigan is a relatively large state by resident population and there are fewer roads per-capita on which road funding must be expended compared to a typical state.
The most relevant index components are the evaluations of funding per system centerline mile, and system lane-miles plus bridge costs. By these metrics, Michigan ranks 27th, and 26th, respectively–very near the median state.
Our analysis concludes that Michigan ranks 30th nationally in road funding, overall. This is slightly below the median state. We have also compared Michigan’s road funding levels to ten peer states. In the 11-state peer group, Michigan ranks 7th in overall funding.
A previous evaluation of statewide pavement conditions ranked Michigan 40th nationally in pavement quality. And 10th of 11 compared to peer states.
Multiple variables may explain the gap between funding levels and resulting pavement quality.
For example, it may be that historical funding levels (previous to 2012) have created a maintenance backlog that continues to challenge Michigan road agencies. Other possibilities include challenges related to Michigan’s wet-freeze climate and related pavement damage. Michigan’s unique truck weight laws may also be imposing additional construction and maintenance costs not experienced in other states.
An additional potential avenue of investigation is that approaches to asset management can vary across states. Making the best use of available funding is a complex network optimization problem that can benefit from a data-based decision support system and coherent integration across maintenance and construction planning. Michigan’s challenges in this regard are further complicated by our distribution of the ownership of the public road network; a lesser percentage of the network is controlled by the Michigan DOT compared to other states, and local ownership is distributed across 614 county and municipal road agencies.
Several of Michigan’s peer states might serve as models on which to inform Michigan’s approach to road funding and pavement management.
Five of Michigan’s peer states rank within the top 15 nationally in pavement quality. Georgia and Indiana perform especially well, ranking #1 and #5 respectively. Notably, four of Michigan’s peer states (Tennessee, Georgia, Missouri, and Indiana) rank below Michigan in funding, yet above Michigan in pavement quality.
An upcoming web post will evaluate the correlations between our Pavement Quality Index and Road Funding Index in an attempt to explain the gap between Michigan’s pavement quality ranking (40th) and road funding ranking (30th).
Primary Author: Eric Paul Dennis, PE – epdennis@crcmich.org
Related Posts
Identifying Michigan’s Highway Infrastructure Peer States (January 2024)
Michigan Ranks 40th in Road Pavement Quality Assessment (April 2024)
Michigan’s Highway Funding is Undermined by Recent Construction Cost Inflation (May 2024)
Fix the Damn Road Funding Formula (February 2022)
