
March 25, 2025
In a Nutshell
- Michigan is working to ‘fix the damn roads,’ supported by recent increases in state and federal funding. Yet this effort has been undermined by unprecedented inflation in the cost of construction. The Federal Highway Administration estimates that highway construction costs have increased by 62 percent from 2020 to the third quarter of 2023.
- Highway construction costs in Michigan have been lower than the national average since 2020, but still have increased 12 percent above expected historical rates. This reduced the purchasing power of Michigan’s road agencies by over $700 million in 2023 alone.
- Michigan’s road agencies generally have significantly more funding than anytime in the past. However, this funding is not going as far as would have been expected only a few years ago. Agencies remain challenged to utilize existing funding levels to catch up with historical maintenance backlogs and bring Michigan’s roads and bridges into a state of good repair.
Like many states, Michigan has long struggled to maintain its road and bridge assets. Increasing transportation revenue through taxes and fees is a political challenge. Compounding this challenge, the purchasing power of new funding can be undermined by ongoing cost inflation. United States consumer prices have experienced substantial inflation rates since 2020 and construction costs have increased even more rapidly. The recent increases in construction costs have reduced the capacity for Michigan’s road agencies to ‘fix the damn roads.’
In 2015, a road funding package was enacted to increase Michigan’s annual transportation revenue by an estimated $1.2 billion by 2021. Subsequent gains in state and federal funding increased Michigan’s transportation budget from $3.7 billion in 2015 to $6.1 billion in 2023. Expenditures on road and bridge programs, specifically, increased from $2.9 billion in 2015 to $5.7 billion in 2023. In nominal dollars, this represents a healthy 99 percent increase over these eight years. But when adjusting for inflation, the purchasing power of this funding is much lower.
Construction cost inflation has increased at an unexpected and unprecedented rate since 2020.
Road agencies forecast construction inflation rates, and use this information when planning and programming capital improvement projects years in advance. However, construction cost inflation has increased at an unexpected and unprecedented rate since 2020. We can evaluate these trends through highway construction cost indices.
Highway Construction Cost Indices
The Federal Highway Administration (FHWA) has maintained the National Highway Construction Cost Index (NHCCI) since 2003. The NHCCI can be used both to track price changes associated with highway construction costs, and to convert current dollar expenditures on highway construction to real or constant dollar expenditures. While road agencies anticipate and account for inflation in construction costs, the NHCCI shows unprecedented inflation beginning in 2021.
The most recent NHCCI data point reflects the third quarter of 2023. FHWA estimates that the national average of highway construction costs has increased by nearly 70 percent over the previous 11 quarters – less than three years.
Our own analysis of the highway construction costs uses the seasonally adjusted NHCCI figure that accounts for seasonal cost variations that are typical in construction work. This was considered a more appropriate figure by which to compare the NHCCI to Michigan data, which was made available as an annual rather than quarterly inflation rate. Per the seasonally adjusted NHCCI, FHWA estimates 61.7 percent construction cost inflation between 2020 Q4 and 2023 Q3.
Fortunately, construction cost inflation in Michigan has not been so drastic. Michigan developed the Michigan Highway Construction Cost Index (MHCCI) in 2020 (with data going back to 2010). The MHCCI estimates that construction costs in Michigan have increased by 26.4 percent since 2020.
While Michigan’s 26.4 percent construction cost inflation since 2020 is much less than the 61.7 percent national average, it is still much more than would typically be expected. MDOT has traditionally assumed a four percent annual cost escalation. This would have resulted in 12.5 percent cost inflation from 2020 to 2023, less than half of what actually occurred.
Our analysis uses 2015 as a baseline year to evaluate construction costs and funding levels to better understand the changes that have occurred since the 2015 passage of Michigan’s transportation funding bills. Chart 1 graphs the MHCCI and NHCCI using 2015 as a base year.
Chart 1
Michigan and National Highway Construction Cost Index (Base Year 2015)

As seen in Chart 1, construction costs in Michigan correlated closely with national trends from 2015 to 2021. Further, both the NHCCI and MHCCI validated the four percent annual inflation assumption traditionally used by MDOT. However, given the rapid inflation since 2020, construction costs increased 82 percent nationally and 49 percent in Michigan from 2015. Had the four percent baseline assumption continued to hold, Michigan would have experienced 37 percent cost inflation from 2015 to 2023, 12 percent less than what actually occurred.
Michigan is one of only a handful of states that calculate a highway construction cost index that is comparable to the NHCCI. Of the other states that calculate an index, we were only able to find this information publicly available for three: Ohio, Wisconsin, and Iowa. The indices for these states are graphed with the MHCCI and NHCCI in Chart 2.
Chart 2
Highway Construction Cost Indices for Michigan, Ohio, Wisconsin, and Iowa (Base Year 2015)

Chart 2 shows that the four states for which construction cost inflation data is available more closely correlate with each other than with the national average.
If we use 2020 as a base year (when the NHCCI began showing rapid inflation), the four states correlate even more closely (Chart 3).
Chart 3
Highway Construction Cost Indices for Michigan, Ohio, Wisconsin, and Iowa (Base Year 2020)

As shown in Chart 3, construction cost inflation for Michigan, Ohio, Wisconsin, and Iowa has been far lower than the NHCCI since 2020, ranging from 23 to 26 percent. This suggests significant variations in construction cost inflation across all 50 states, with many states likely experiencing inflation far in excess of the 62 percent national average inflation since 2020. Michigan and the other three states shown are fortunate to have experienced a lower rate of inflation, but have still been subject to unprecedented and unexpected increases in highway construction costs in recent years.
Michigan Construction Cost Inflation Components
Highway construction cost indices are calculated by aggregating costs of individual construction bid items, which allows us to evaluate the contribution of individual components. The MHCCI breaks down costs into ten weighted categories. The seven categories that contribute the most to overall construction costs (about 90 percent of the MHCCI) are graphed in Chart 4. The approximate percentage contribution of each category to the MHCCI is provided in the chart legend.
Chart 4
MHCCI Major Component Cost Inflation (Base Year 2015)

The most impactful construction category is hot-mix asphalt (HMA) pavement, making up about 42 percent of MDOT’s overall construction costs. This category includes all work that involves adding asphalt to the pavement, from complete reconstruction projects to filling potholes. Fortunately, cost inflation in this category has been relatively low since 2015, at 35 percent.
The second highest-weighted contribution is “Bridges & Special Structures + Structural Steel” (or “bridges+”). This accounts for about 11 percent of MDOT’s construction costs. This category includes all construction and maintenance activities for bridges, as well as other “special” structures such as abutments and retaining walls. Since 2015, bridges+ costs have increased by 62 percent, significantly contributing to the overall 49 percent increase in the MHCCI.
Other categories contribute no more than 10 percent of overall construction costs each. However, two categories show substantial cost inflation: earthwork and bases.
Earthwork includes all excavation activities relating to the removal of existing pavement and structures, as well as backfilling and grading. Also within this category are items for things like land clearing, tree removal, and soil erosion control. The earthwork category of the MHCCI peaked at 2.16 in 2022, meaning that MDOT was paying more than twice as much in 2022 as in 2015. Fortunately, costs have recently declined. As of 2023, earthwork costs are estimated to be 80 percent greater than in 2015.
The bases category includes all activities that involve the installation of road base materials such as sand and gravel, as well as recycled pavement and geotextile products. This category shows 85 percent cost inflation in 2023 relative to 2015, the highest increase of any component. While only about 6 percent of overall project costs, the cost increase of bases has significantly contributed to overall construction cost inflation.
Regional Variations in Michigan
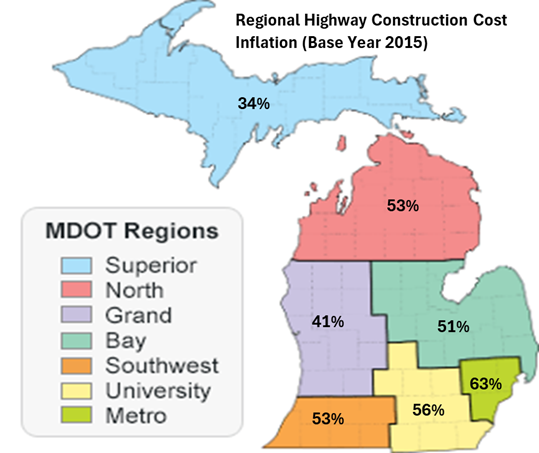
In addition to its statewide measure, MDOT reports construction cost inflation for individual regions. Using 2015 as a baseline year, cost increases range from 34 percent in the Upper Peninsula to 63 percent in the Detroit Metro region (map below).
Map
Highway Construction Cost Inflation in MDOT Regions, 2015 – 2023
The differences in cost inflation between MDOT regions has implications for planning and distribution of funding. MDOT has historically assumed an annual construction cost inflation rate of four percent, which would accumulate to a 37 percent overall increase from 2015 to 2023. The Superior Region has seen inflation rates below this rate, which would generally make project planning and programming relatively straightforward. In contrast, inflation in the Metro Region has increased 26 percent above what would be expected, likely requiring some planned projects to be delayed or canceled.
The data in the MHCCI includes only MDOT projects. However, the general inflation trends revealed by the MHCCI likely correlate to costs borne by local road agencies. These local agencies are largely funded through Public Act 51 formula-driven Michigan Transportation Fund appropriations, which does not account for regional differences in construction costs. Many local road agencies in high inflation regions are likely very challenged to efficiently plan construction work across their network, as well as maintain the roads in areas where a dollar of funding does not purchase as much construction work.
Purchasing Power of Michigan Highway Expenditures
We are interested in evaluating the purchasing power of Michigan highway expenditures following the passage of the 2015 transportation funding increases. Chart 5 graphs the relative increase in road and bridge expenditures from 2015 to 2023. By subtracting the rate of construction cost inflation from expenditures, we can estimate the purchasing power of road funding in Michigan.
Chart 5
Michigan Road & Bridge Expenditures, Expected Purchasing Power, and Actual Purchasing Power (Base Year 2015)
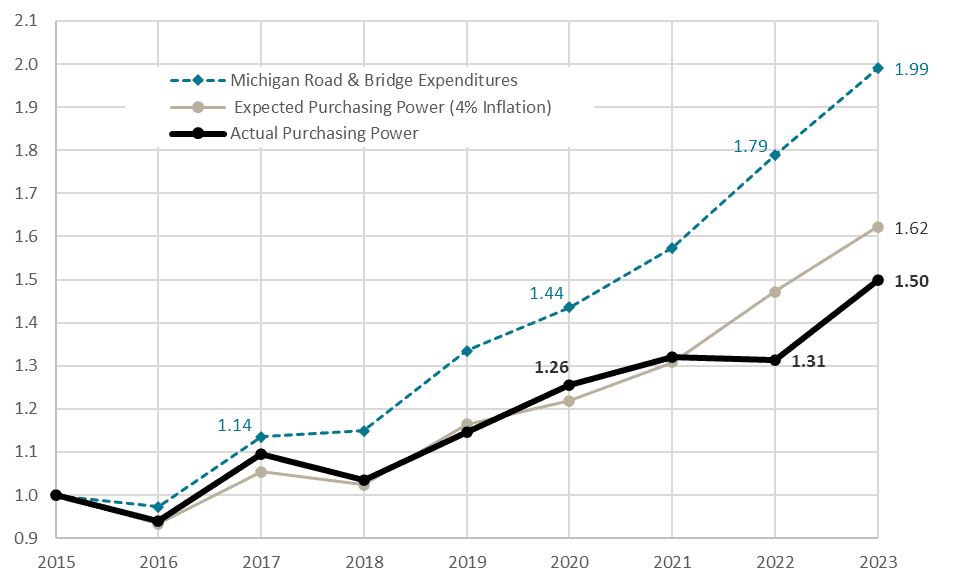
In nominal dollars, Michigan’s expenditures on road and bridge programs increased by 99 percent from 2015 to 2023. However, adjusting for construction inflation shown by the MHCCI (49 percent) suggests that the construction purchasing power of highway expenditures has increased by only 50 percent.
When we break-out expenditures by MDOT on the state trunkline system and expenditures by Michigan’s local (county and municipal) road agencies, we can observe distinct trends. Chart 6 graphs MDOT and local agency expenditure increases in both nominal dollars and adjusted for construction cost inflation.
Chart 6
Construction Purchasing Power of Michigan Highway Expenditures Categories (Base Year 2015)
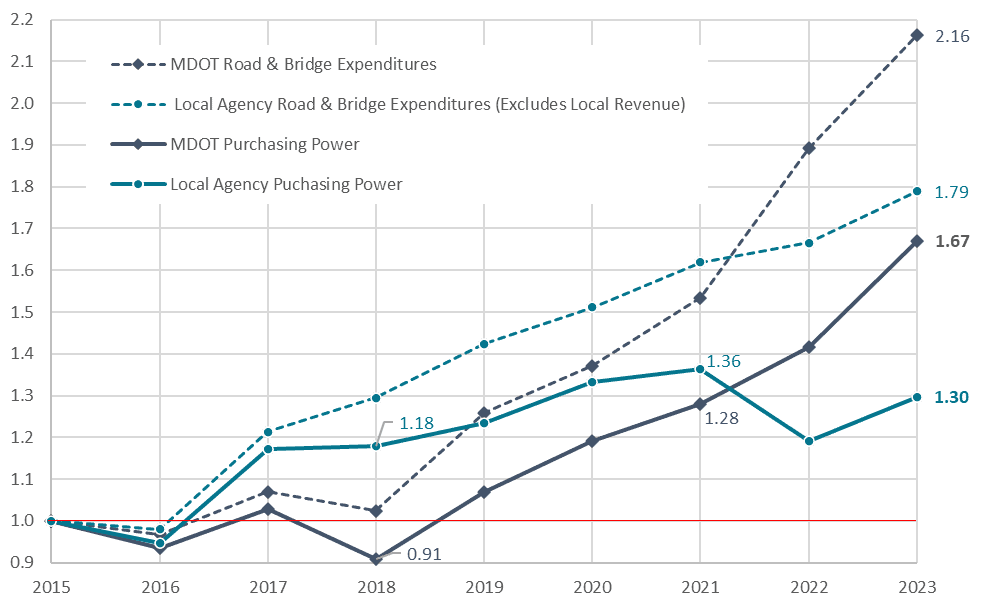
Chart 6 shows that local road agencies benefited more than MDOT from the highway funding increases adopted in 2015 (which began to take effect in 2017). However, MDOT’s expenditures increased substantially in 2022 and 2023, buoyed by projects funded by the “Rebuilding Michigan” bond program. In nominal dollars, MDOT’s expenditures have more than doubled since 2015 (a 116 percent increase). When adjusted for construction cost inflation, this still represents a substantial 67 percent increase in purchasing power. Notably, 24 percent of MDOT’s 2023 expenditures ($810 million) were bond funded. Servicing this debt will reduce MDOT’s ability to fund capital improvement projects in future years.
Local road agency expenditures increased 79% in nominal dollars from 2015 to 2023. This figure includes distribution of MTF revenue to local agencies and federal aid funds expended for projects under local jurisdiction, but omits local revenue sources (e.g., local road millages). When adjusted for construction inflation, this translates to a 30% increase in purchasing power.
If Michigan road agencies had experienced the expected four percent annual rate of inflation since 2015, purchasing power for both MDOT and local agencies would be about 12% greater. For MDOT, this means that about $415 million of 2023 expenditures was lost to unanticipated cost inflation. Local agencies were shorted about $293 million in 2023 from state and federal funding alone.
Caveats
This analysis used highway construction inflation cost indices as provided by the FHWA and state departments of transportation in Michigan, Ohio, Wisconsin, and Iowa. Differences in methodologies, data availability, and reporting by different fiscal years may affect the resulting index numbers and caution should be taken in conclusions regarding comparisons.
Inflation vs. Costs
Construction costs can vary substantially by state. For example, the FHWA has estimated that bridge construction in 2020 ranges from $75 per sq. ft in Texas to $1,230 per sq. ft in Hawaii.
The analysis presented here evaluates construction cost inflation relative to a base year. We cannot draw any conclusions about relative costs in any year when comparing any states or regions to each other or national costs.
MHCCI Components
The discussion on the categories that comprise the MCHHI included estimates of the weight by which each cost category contributes to MDOT construction costs. These weights were calculated by Western Michigan University in 2020, using data from 2010 – 2019. It is likely that these weights are no longer entirely accurate due to varying cost inflation in each category, evolving project mixes, engineering standards, etc. However, they are believed to be generally representative, particularly with respect to HMA pavement having the most influence.
Regional Variations
Regional construction cost inflation rates were provided directly by MDOT. It is unclear if there were methodological differences in deriving these figures, and available data suggests different approaches in calculating regional indices versus the MHCCI. As each region has only a fraction of all statewide construction projects in a given year, regional inflation calculations are less statistically powerful and may be heavily influenced by individual projects.
Additionally, in evaluating regional inflation we must remember that this analysis cannot provide any information about comparative costs. For example, while the Metro Region has seen the highest rate of cost inflation from 2015 to 2023, we cannot conclude that construction costs in this region were the highest in the state.
Purchasing Power
This analysis includes a discussion of purchasing power to recognize that while construction inflation has been unprecedented since 2021, Michigan has also seen substantial increases in state and federal funding since 2015.
Michigan Road & Bridge Program Expenditures include distribution of Michigan Transportation Fund revenue to the State Trunkline Fund and local agencies (HFA 2024), federal-aid highway funds expended by the state of Michigan, including federal-aid highway funds expended for projects under local road agency jurisdiction (HFA 2023), and expenditures on projects funded by “Rebuilding Michigan” bonds (MDOT 2023). Some 2023 expenditures are estimated from budgeted appropriations.
These expenditure line items include administrative, planning, and engineering activities, as well as debt servicing. Conversion of these expenditure figures to purchase power embeds an assumption that all activities funded are inflating at the rate of the MHCCI; this is certainly not the case for some expenses and thus can provide only a general baseline for estimating purchasing power. Actual purchasing power is probably somewhat higher than our estimates.
Conclusions and Discussion
Our analysis utilizes the MHCCI baselined to 2015 when the legislature passed a series of road funding bills. From 2015 to 2023, Michigan highway construction costs have increased an estimated 49 percent.
As a result of the additional state revenue and “Rebuilding Michigan” bond funding, as well as increased federal funding, expenditures on road & bridge programs in Michigan increased from $2.89 billion in 2015 to $5.75 billion in 2023. This signifies a substantial 99 percent increase in spending on Michigan’s roads and bridges in nominal dollars.
When accounting for construction cost inflation, Michigan’s road agencies have about 50 percent more purchasing power in 2023 than in 2015.
Expenditures on roads and bridges in Michigan nearly doubled from 2015 to 2023, yet the purchasing power of agencies increased only about 50 percent when adjusted for cost inflation.
While this is a meaningful increase in funding, recent construction cost inflation has impacted the ability of Michigan road agencies to plan, program, and execute capital improvement projects. Had construction cost inflation continued at the historical baseline rate of four percent from 2015, Michigan would have been able to fund about 12 percent more work in 2023. Considering the $5.75 billion spent on road and bridge projects in 2023, over $700 million was lost to unexpected inflation in this year alone.
Michigan Road Agencies lost over $700 million to unexpected inflation in 2023 alone.
Assessing the regional contributions of the MHCCI shows that construction costs have increased at different rates around the state from 2015 to 2023. This ranges from 34 percent in the Superior Region (the Upper Peninsula) to 63 percent in the Detroit Metro Region. This puts added pressure on the MDOT and regional planners to optimize capital improvement programming. Road agencies in Michigan begin planning such projects five years in advance, and unexpected inflation rates may require time-consuming re-assessment, re-allocation, and difficult decisions in selecting projects that may have to be dropped.
Differences in construction cost inflation across Michigan’s regions is likely further constraining the ability of local agencies in high-inflation regions to maintain roads and bridges.
While MDOT has some ability to shift funding between regions, the variable inflation shown in the regional MHCCI indices likely also applies to local agencies within those regions. The Act 51 distribution formula is based on factors such as road miles and population. It does not account for variable construction costs.
Our analysis does not assess the actual construction costs borne by any particular road agency within any region. However, it is likely that local road agencies in areas of high construction inflation are now struggling to optimize investment strategies and are relatively underfunded compared to areas where construction costs are more stable.
Generally, Michigan is fortunate to have seen construction cost inflation rates well below the national average. Yet construction inflation is still imposing difficulties and has undermined recent funding increases. This is an important factor to consider when discussing highway funding policy.
Primary Author: Eric Paul Dennis, PE – epdennis@crcmich.org
Related Posts
Michigan Ranks 40th in Road Pavement Quality Assessment (April 2024)
Fix the Damn Road Funding Formula (February 2022)
Public Act 51 – The ‘Third Rail’ of Michigan’s Pothole Crisis (March 2018)
