
July 28, 2026
In a Nutshell
- A novel method provides a multi-factorial index score to evaluate statewide pavement conditions across multiple metrics.
- Michigan ranks 40th nationally, and tenth in an eleven-state peer group for overall pavement quality.
- This analysis can help to evaluate funding adequacy, as well as identify inefficiencies in current resource allocation and management strategies.
A multi-factorial index was created to compare the quality of Michigan’s roads to peer states and the national system. Notwithstanding limitations of the data, we found Michigan’s road quality to rank 40th nationally and tenth among a peer grouping of 11 states. We plan to continue this research to evaluate adequacy of funding levels, as well as policy changes regarding revenue allocations and investment strategies.
This post assesses road pavement quality in Michigan by comparison to these peer states as well as national rankings.
Evaluating pavement quality for a statewide public road network is not straightforward. Pavement condition is reported using a variety of metrics applied to a variety of road types. Data collection practices may vary, with states using different types of equipment or manual methods, leading to differences in data quality. Reporting in some states is less complete than others, resulting in data gaps and reduced confidence that the reported data accurately reflects the condition of the network. Further, there is often an extended lag in reporting. For some categories, the most recently available data reflects conditions as far back as five years.
Notably, there is no data available for all public roads in Michigan or any other state. The federal government collects and reports data only for roads that are eligible for federal aid, which excludes those classified as local roads or rural minor collectors.
The Federal Aid Eligible System
The Federal Highway Administration (FHWA) reports pavement condition on the federal aid eligible (FAE) system, which is the broadest road classification for which state-comparable pavement data is available. Michigan’s FAE network covers about a third of the 120,115-mile statewide public road network. This includes routes classified by function as expressways, arterials, and collectors. Nearly all of the state-owned trunkline system is FAE eligible, but many locally-owned roads are also included. In Michigan, 53,291 miles of FAE roads (67 percent of the FAE network) are under the jurisdiction of local road agencies.
Unfortunately, the data available for the FAE network is not particularly reliable or easy to interpret. States report pavement condition on the FAE system using four individual pavement condition metrics: roughness, cracking, rutting, and faulting.
Not every mile of road is assessed; much of the system condition is estimated using statistical sampling. Some states have provided incomplete data even allowing for sampling. Further, the most recently available data for the entire FAE system was collected in 2020–now rather dated. Michigan, uniquely, did not collect pavement condition data in 2020 and thus Michigan’s most recently available FAE pavement data was collected in 2019. It can be expected that Michigan’s FAE system has improved since 2019 with increases in state and federal road funding, as well as the “Rebuilding Michigan” bond program.
With such caveats in mind, it is worthwhile to include the FAE pavement condition data as a component of a broader evaluation of statewide pavement conditions. Without this component, any evaluation would only reflect the more limited National Highway System (NHS). Cross-checking this data against other sources suggests that in most cases it is consistent and thus judged to accurately reflect relative pavement conditions on the FAE system, and likely correlates to general conditions statewide.
Roughness
Pavement roughness is a measurement of deviation from a perfectly smooth surface, most often assessed by the international roughness index (IRI). IRI values typically reflect underlying failures in the pavement – but not necessarily, as it is possible for rough pavement to be in structurally good condition. Some states report roughness for some routes not by IRI, but by an alternative metric called present serviceability rating (PSR). While both metrics reflect pavement roughness, and thus perceived ride quality, they derive the measurement by different methods. Generally, whether measured by IRI or PSR, a roughness rating of poor would be experienced by drivers as perceivably rough pavement.
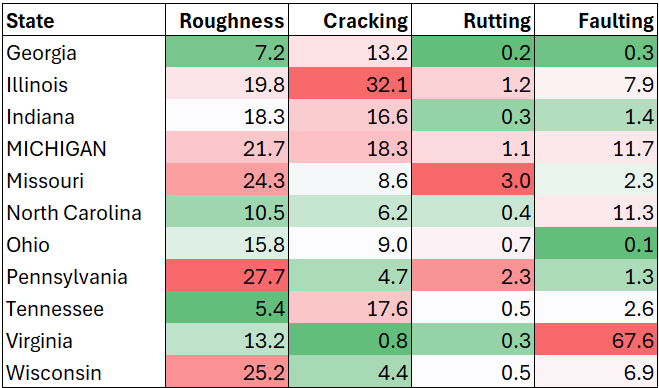
Michigan reported that 21.7 percent of the FAE system was in poor condition by IRI/PSR. Michigan ranks 30th nationally and eighth among our 11-state peer grouping.
Cracking

The cracking metric reflects visible cracking on a pavement surface. As with IRI, the cracking metric may reflect pavement in some state of failure–but not necessarily so. Some pavement cracking occurs naturally with age, and may not be problematic so long as the cracks are appropriately sealed and maintained. That said, when visible cracking becomes so prevalent that the road surface is gauged in poor condition, it likely reflects pavement that is in some state of failure.
Michigan reported 18.3 percent of the FAE network in poor condition by the cracking metric. This ranks 45th nationally, and 10th of 11 among peer states.
Rutting
Pavement rutting occurs on flexible asphalt pavements exhibiting structural failure of either the pavement surface or subsurface base layers. Rutting may not impact perceived ride quality but is often a precursor to more noticeable distresses such as cracking and potholes. Rutting itself can be a safety hazard in wet conditions, as water or ice may accumulate in the ruts. A pavement section is considered to be in poor condition when the average depth of rutting is greater than 0.4 inches.
Michigan reported 1.1 percent of FAE asphalt pavements were in poor condition by rutting. This ranks 26th nationally, and 8th of 11 compared to peer states.
Faulting

Faulting is a failure mode specific to jointed concrete pavements (JCP) and is simply a direct measurement of the vertical difference in pavement surface elevation at the joint. Roadway segments are considered in poor condition by faulting when the average fault is greater than 0.15 inches. State-by-state comparisons of pavement faulting are difficult because JCP construction is much less common than asphalt pavements, and some states have very little of this pavement type. For example, while Virginia reports that 67.6 percent of the state’s FEA JCP pavement is in poor condition by faulting, it has only 104 miles of this pavement, compared to 2,306 miles on the FAE system in Michigan.
Michigan reported that 11.7 percent of FEA JCP pavement was in poor condition by faulting. This ranks 35th nationally and 10th of 11 among peer states.
Table: Percentage of Federal Aid Eligible Pavement in Poor Condition by Metric for Michigan and Peer States, Listed Alphabetically (2019/2020 Data)
Due to questionable data quality and the limited utility of each individual metric, we should be cautious in the interpretation of this data. However, looking across the metrics reveals a consistent trend. Michigan’s FAE pavement condition ratings tend to be slightly below average to well below average, both nationally and compared to peer states.
The National Highway System
Comparatively better data is available on the National Highway System (NHS), which is a subset of the FAE system. The NHS includes all Interstate routes and expressways, as well as other major routes determined to be of national importance. While the NHS includes only about 5.3 percent of Michigan’s public road network by route mile, it does cover the most strategically important and high-traffic routes. In Michigan, 4,376 miles of NHS roads (20 percent of the NHS network) is under the jurisdiction of local road agencies.
The most comprehensive pavement condition on the NHS is available through the FHWA Transportation Performance Management (TPM) program. This program was initiated to encourage states to adopt strategic data-based approaches to asset management.
States report the percentage of NHS lane miles in good, fair, and poor condition using the standardized federal pavement condition metric (PCM). The PCM is based on a combination of the fundamental pavement condition metrics previously introduced (IRI, cracking, rutting, and faulting). All underlying metrics must be found to be “good” for the resulting PCM score to be good. If two or more metrics are ranked “poor,” the resulting PCM for that pavement is determined poor. Otherwise, the pavement is judged to be in fair condition.
TPM data is reported separately for Interstate and non-Interstate NHS routes.
Interstate Routes
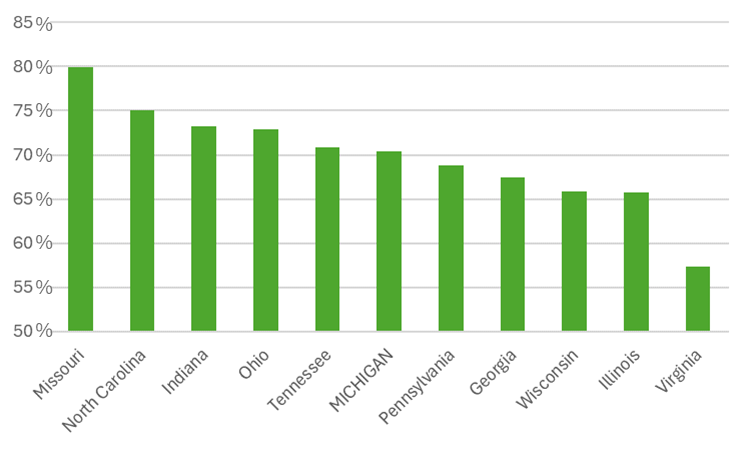
Michigan reported that 70.4 percent of Interstate pavement was in good condition by PCM. This ranks 18th nationally and places Michigan as the median state (6th of 11) among peer states.
Chart: Percentage of Interstate Lane-miles in Good Condition by PCM (2021 Data)
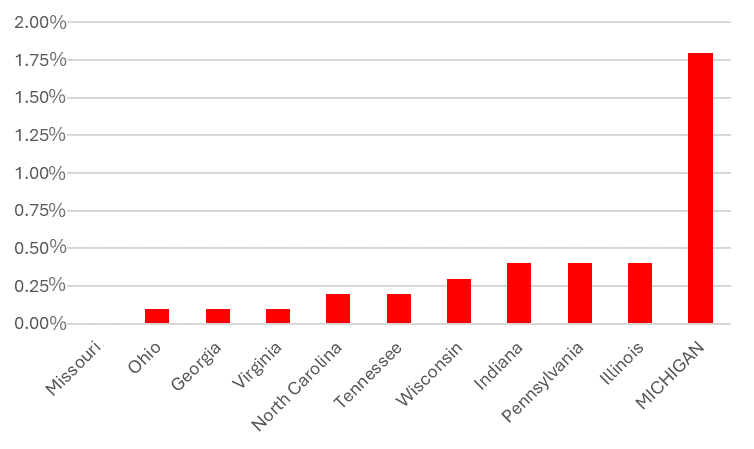
While Michigan ranks relatively high in Interstate pavement in good condition, the state ranks low in Interstate pavement in poor condition. Interstate routes tend to be relatively well-maintained, and because two or more individual metrics must be ranked poor to derive an overall score of poor, a very low percentage of Interstate pavement is rated in poor condition by PCM. Only 1.8 percent of Michigan’s Interstate pavement is in poor condition. Yet, this results in the state ranking lowest among peer states and 44th nationally.
Chart: Percentage of Interstate Lane-miles in Poor Condition by PCM (2021 Data)
Non-Interstate NHS Routes
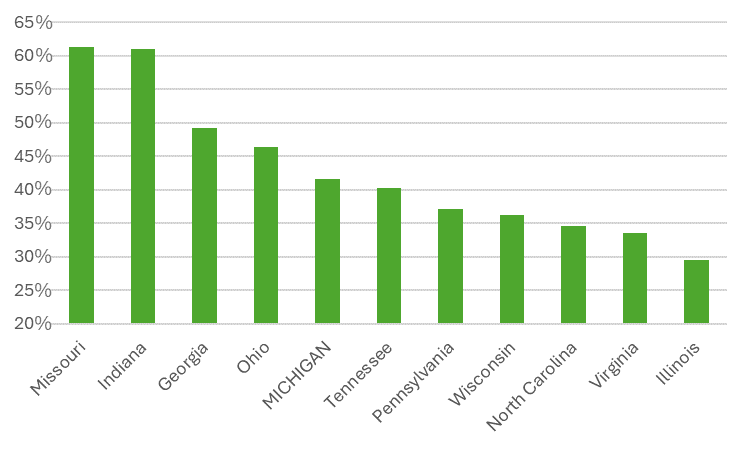
Non-Interstate NHS pavements tend not to be maintained in as good condition as Interstates. Only 41.6 percent of Michigan’s non-Interstate NHS pavement was reported in good condition. However, this is above the median state performance; Michigan ranks 22nd nationally by this metric, and 5 of 11 compared to peer states.
Chart: Percentage of Non-Interstate NHS Lane-miles in Good Condition by PCM (2021 Data)
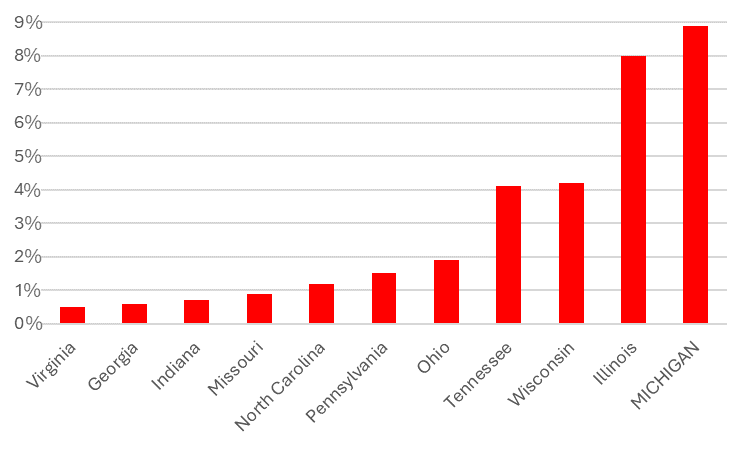
As with Interstate routes, Michigan reports a notable discrepancy in good vs. poor ranking on non-Interstate NHS pavements. For non-Interstate NHS in poor condition, Michigan ranks 47th nationally and last among peer states with 8.9 percent in poor condition.
Chart: Percentage of Non-Interstate NHS Lane-miles in Poor Condition by PCM (2021 Data)
NHS Bridge Surface
The TPM program also provides data on NHS bridge surface conditions. Notably, this data reflects only the condition of the bridge riding surface and is not an overall structural assessment of the bridge (which includes foundations, substructures, support beams, and more). A bridge surface can be rated in good condition while other elements of the structure are found to be deficient. Alternatively, a bridge with a rough riding-surface rated in poor condition may otherwise be structurally sound. A more comprehensive structural assessment of bridge condition is provided by the National Bridge Inventory (this data has not been included in this evaluation).
Per TPM reporting, 22.1 percent of Michigan’s NHS bridge surface pavement was in good condition. This ranks 40th nationally and is last among peer states. Michigan reports 7.0 percent of NHS bridge surfaces in poor condition resulting in a national ranking of 41st and a peer-state ranking of 9th of 11.
A Novel Multifactorial State Pavement Condition Index
As previously discussed, it is difficult to draw conclusions from any individual measure of pavement condition. Each metric reflects a limited aspect of pavement condition and may be otherwise subject to data quality and reliability issues. To address this complication, we have developed a multifactorial statewide pavement condition index based on 17 individual metrics across various road classifications. In addition to the findings discussed above, we have incorporated pavement roughness data as provided by the 2022 FHWA Highway Statistics Series (tables HM-63, HM-64, HM-47, and HM-47A).
For each of the 17 metrics, the percentage of pavement in good or poor condition is first converted to an individual index score based on the range of reported data across all 50 states. For example, North Dakota has the highest percentage of Interstate pavement in good condition by PCM, with 82.9 percent. The lowest-ranked state is Louisiana, with 17.1 percent. When converted to the index, North Dakota scores as 100, and Louisiana scores as zero (0). Michigan reports that 70.4 percent of Interstate pavement is in good condition. The difference between Michigan and Louisiana’s percentage-good data is 81 percent of the difference between North Dakota and Louisiana [(70.4-17.1)/(82.9-17.1) = 0.81]. Thus, Michigan is assigned an index score of 81 for this category.
The 17 individual index scores are then combined into a weighted average that reflects perceived criticality to system pavement condition, data timeliness, and potential data quality issues. No individual metric is weighted more than 10 percent, thus the summary index score overwhelms outlier figures and reflects broad trends. This provides a valuable metric by which to compare pavement quality on a state-by-state basis.
Each individual score, as well as the combined weighted index score, is provided for all 50 states, below.
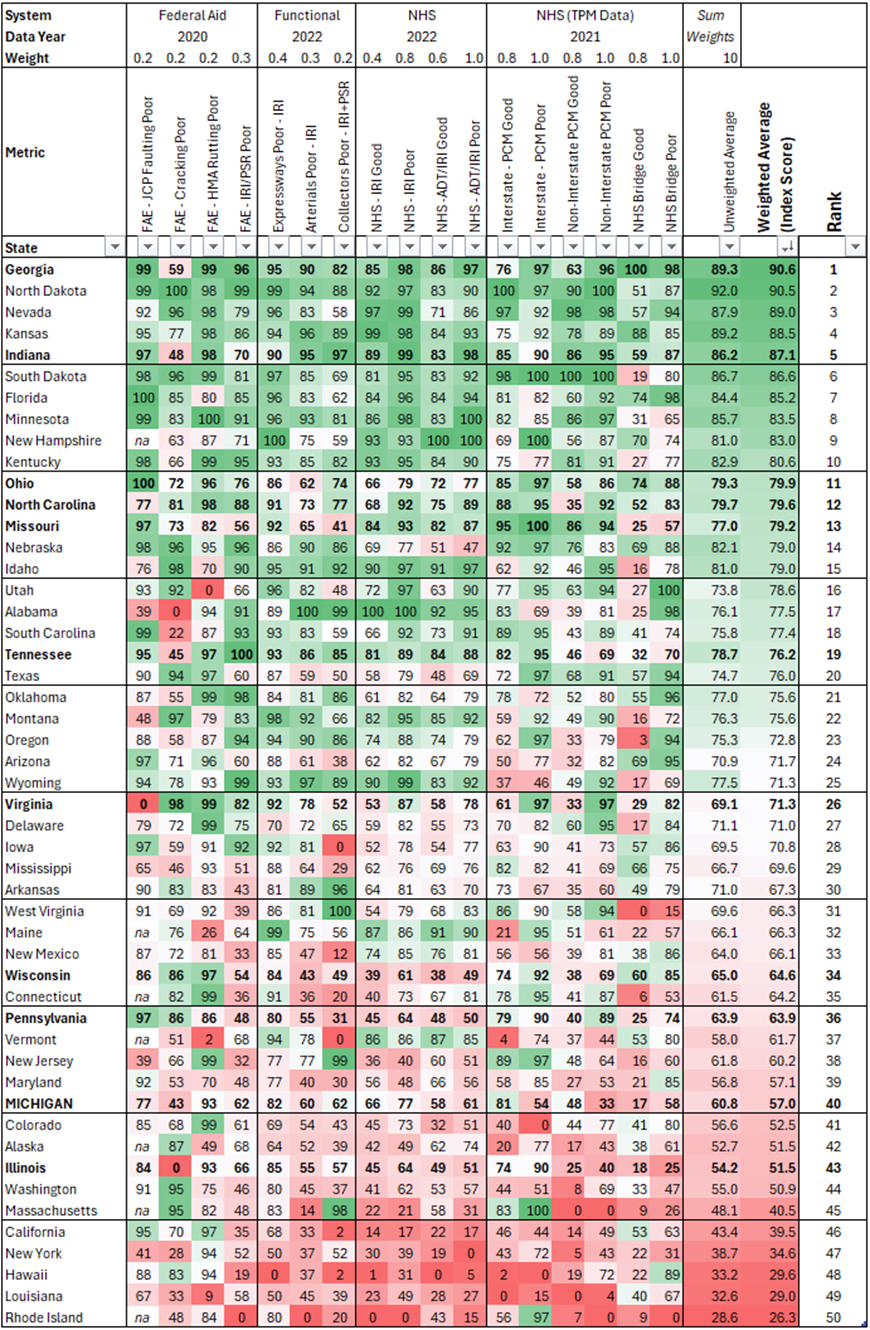
Table: Summary Results of the Multifactorial Pavement Index (Michigan and Peer States Rendered in Bold)
Using this method, Michigan ranks 40th nationally with a weighted average index score of 57.0. This is 10th of 11 compared to peer states, with only Illinois ranking lower.
Michigan’s highest individual score (93) reflects the percentage of FAE routes in poor condition by rutting. This is one of the categories where the data is not only dated but is of questionable reliability due to approaches in data collection and statistical sampling. Considering that, the category is de-weighted, contributing only 2 percent of the summary index score.
Michigan’s second-highest score reflects pavement roughness (IRI) on expressways. This includes interstates as well as non-Interstate limited-access highways. Michigan reports 4.2 percent of expressways in poor condition by IRI, translating to an index score of 82. While this is a relatively high score with respect to all categories, it is somewhat related to the scoring methodology and the “long tail” distribution of the underlying data for this metric. Specifically, the scores are skewed by Hawaii reporting 23.8 percent of expressways in poor condition by IRI. For reference, the median state index score for this category is 88.
Michigan also scores high in Interstate lane-miles in good condition by PCM (81). This is a bright spot in Michigan’s evaluation, as this is a fairly reliable, pertinent metric, and places Michigan as 18th best among all states. This category contributes 8 percent of the overall index score.
In other categories, Michigan tends to rank from about average to moderately below average.
Michigan’s lowest score (17) reflects the percentage of NHS bridge surface area in good condition. Michigan’s second-lowest score (33) reflects the percentage of non-Interstate NHS pavement in poor condition by PCM. Low scores in these categories were influential on Michigan’s overall index score, as they are weighted relatively highly (8-10 percent each).
Caveats
The statewide pavement condition index represents a novel approach to infrastructure analysis. Development of the index required engineering and analytical judgments that may not be optimal. There are many more available metrics that could be incorporated into a summary score. Our method generally emphasizes metrics that are as broad in scope as the data allows while limiting redundancy, but may have overlooked important elements.
While five of the metrics reflect pavement in good condition, the majority of categories and subsequent weighting emphasize pavement in poor condition. This approach was adopted because it was deemed more important for a state to prevent pavement from falling into poor condition than it is to provide new pavement in good condition. An alternative approach that emphasizes pavement in good condition may result in different conclusions.
As previously stated, there are data reliability issues within several of the individual categories. We have addressed this issue by combining multiple categories, as well as color-coding the table to allow for the identification of outlier data that may not be representative.
Another issue is that the most recently available data for any category was collected in 2022. Data on the FAE network is even more dated – 2019 for Michigan and 2020 for other states. Increases in state and federal funding, as well as the bonding proceeds, have likely improved many aspects of pavement condition in recent years, so these categories and resulting index may be better considered as a recent historical baseline as opposed to representing current conditions.
Finally, there is no nationally comparable data available on local roads. The data does capture the most strategically important and high-traffic routes but omits the local roads and residential streets that make up much of a state’s public road system by mileage (about two-thirds in Michigan). While county and municipal road agencies have benefited from increases in state and federal funding, they have not benefited from the bonding for state roads.
Discussion and Potential Research Directions
This analysis provides a novel multifactorial pavement condition metric that can be used to assess overall pavement quality for the road systems analyzed across states with reasonable confidence. Michigan’s national rank of 40 and peer state rank of 10 (out of 11 states) supports the conventional wisdom that Michigan’s roads tend to be in relatively poor condition. While the level of analysis presented here is fairly topical, the underlying data can be further evaluated and broken down to derive meaningful insights.
Several potential factors could explain why Michigan’s roads tend to be in poorer condition than a typical state. This may include factors that are typically outside of the scope of policy and administrative practices to affect, such as traffic, climate, and geology. However, the range of pavement quality across the 50 states often does not obviously correlate with such factors, suggesting that influenceable aspects such as funding levels and management approaches are more controlling.
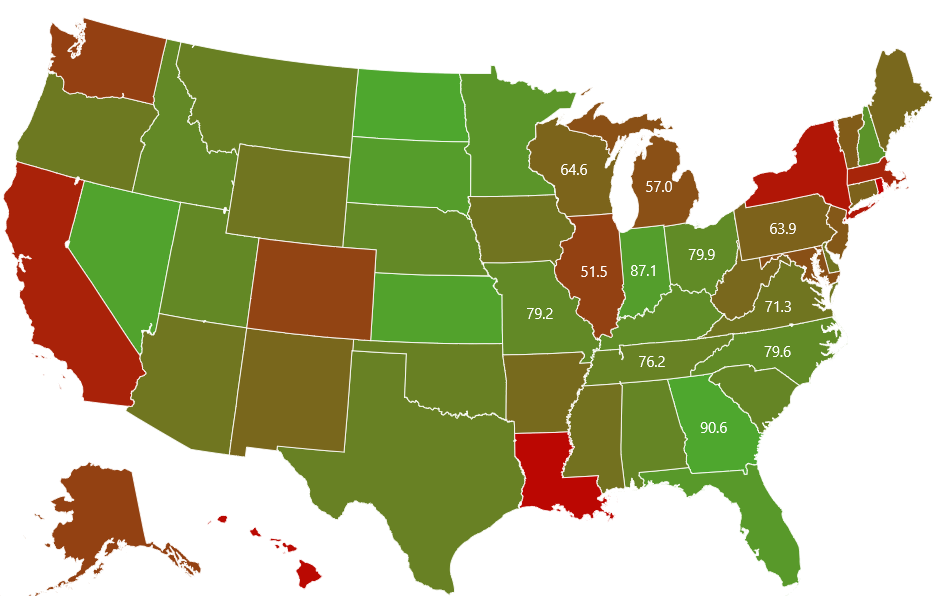
Map: State Pavement Condition Index Scores (Data Labeled for Peer States Only)
The map demonstrates that pavement conditions across the states do not obviously correlate with climate or geology, supporting additional analyses that other policy factors are more influential.
The distribution of good and poor pavement across Michigan often deviates somewhat from national and peer-state trends. Identifying discrepancies may provide insightful details on the condition of Michigan’s roads.
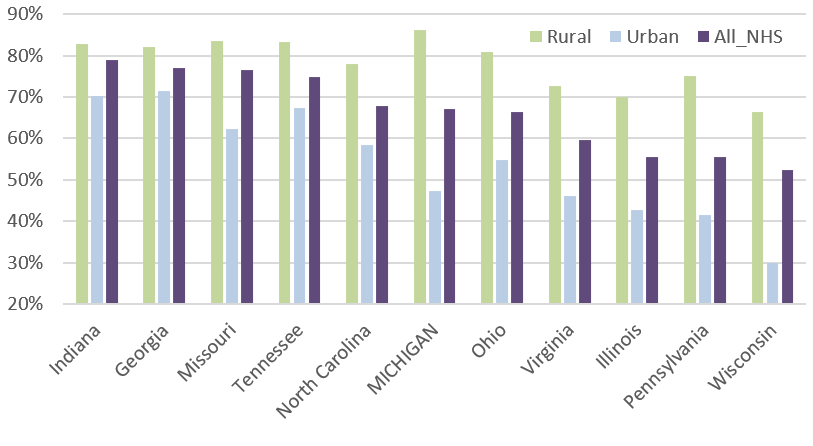
For instance, many of the available tables allow for pavement condition data to be broken down into rural and urban portions of the system. By pavement roughness (IRI), Michigan reports that 67.0 percent of the statewide NHS system is in good condition, ranking 24th nationally. However, when broken down into components, 86.2 percent of rural NHS pavement is reported in good condition; this ranks 7th nationally and is top among peer states. The overall statewide NHS ranking is brought down by urban NHS pavements, which are 47.4 percent good by IRI, ranking 35th nationally.
Chart: Percentage of Rural, Urban, and All NHS Routes in Good Condition by IRI (2022 Data)
Such analyses may help identify specific categories of pavement conditions that contribute to Michigan’s reputation for poor roads, and point to subsequent policy recommendations. In the above example, policymakers may consider reallocating resources from rural NHS pavements to more critical and highly trafficked urban pavements.
Several of Michigan’s peer states might serve as models on which to inform Michigan’s approach to road funding and pavement management. Five of Michigan’s peer states rank within the top 15 nationally. Georgia and Indiana perform especially well, ranking #1 and #5 respectively.
We are conducting ongoing research to better understand how various factors are correlated to the pavement condition data and summary index scores presented in this analysis. A future post is planned that will evaluate historic and current financial data. The findings of such research can help determine the extent to which Michigan’s poor roads are related to funding deficiencies as opposed to other policy and management approaches.
Primary author: Eric Paul Dennis, PE – epdennis@crcmich.org
Related Posts from CRC
Identifying Michigan’s Highway Infrastructure Peer States (January 2024)
Fix the Damn Road Funding Formula (February 2022)
Revised April 11, 2024. The statement, “The entirety of the state-owned trunkline system is FAE eligible” was revised to “Nearly all of the state-owned trunkline system is FAE eligible.” HSS 2022 Table HM-80 reports that 18 miles of local road (by functional class) are state-owned. Additional hyperlink references were added.
