
May 19, 2026
In a Nutshell:
- Michigan road agencies and the construction industry are seeking billions of dollars in yearly funding increases to fix and maintain Michigan’s roads and bridges.
- Many states with similar road funding levels to Michigan have achieved better pavement conditions.
- As Michigan seeks new and expanded revenue options, we should also evaluate the potential to use existing funding better.
Michigan has seen many efforts over the years to get more money to ‘fix the damn roads.’ Yet, analysis of federal data shows that states with the highest levels of road funding are not necessarily the states with the best road conditions. States with some of the best pavement conditions in the nation have funding levels comparable to Michigan. This article will explore factors that may explain why some states perform better than others, and how Michigan may be able to improve road conditions without substantial revenue increases.
Many states have been capable of achieving relatively good pavement conditions with relatively limited funding capacity.
Our multi-factorial Pavement Condition Index ranked Michigan 40th nationally in pavement condition. Our Road Funding Index, using multiple funding metrics from 2012-2021 ranked Michigan 30th in road funding. To evaluate the ‘performance gap’ between Michigan’s Pavement Condition Index and Road Funding Index rankings, we first investigated what the expected relationship should be. One might assume that the more road funding a state has, the better pavement conditions it would achieve. However, the data does not support this intuition.
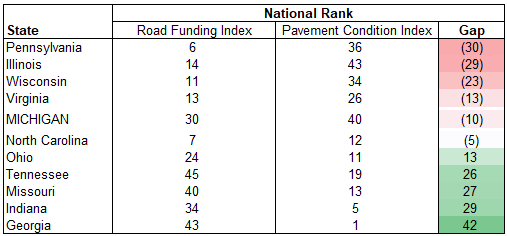
Focusing on peer states, we found that nine of Michigan’s ten peer states have an even larger gap than Michigan between their respective funding and condition index rankings (see Table 1). For example, Pennsylvania boasts a relatively high level of road funding, ranking 6th nationally (buoyed by one of the highest fuel tax rates in the nation). While Pennsylvania also reported better pavement condition than Michigan, the state ranks 36th nationally, resulting in a gap of 30 places. This suggests that while pavement quality may be better in Pennsylvania, Michigan performs better in achieving good pavement conditions relative to its funding commitment. Conversely, states such as Georgia and Indiana have a significant ranking gap in the other direction – ranking much higher in pavement condition than road funding.
Table 1
Road Funding and Pavement Condition Index Ranking for Michigan and Peer States
This lack of a clear relationship between road funding and subsequent pavement condition is not limited to Michigan and its peer states. Figure 1 plots the Pavement Condition Index against the Road Funding Index for all 50 states.
Figure 1
State Pavement Condition Index vs. Road Funding Index
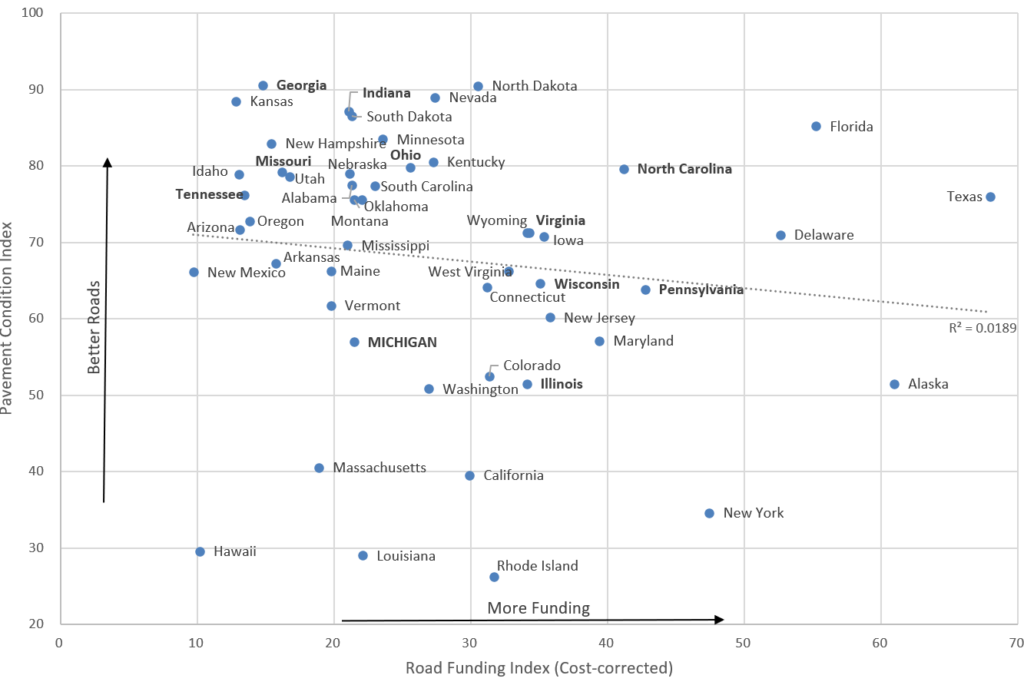
Figure 1 shows very little correlation between pavement condition and road funding across states. Furthermore, 25 states are clustered in the upper-left quadrant with a Road Funding Index score of less than 30 and a Pavement Condition Index score of greater than 60. This shows that half of all states have been capable of achieving relatively good pavement conditions with relatively limited funding capacity. Many outlier states might be explained by factors not captured by the Index construction methodology, such as funding dedicated to capacity expansions (new roads and lanes), high costs related to highway tunnels or landmark bridges, or unique environmental factors. However, many states outside of the upper left quadrant (including Michigan) cannot be easily explained and appear to have the ability to make better use of existing funding.
Available data suggests that states with more road funding are no more likely to achieve better pavement conditions than moderately funded states.
Considering the non-intuitive result that more funding does not reliably result in better pavement conditions, we have evaluated this relationship through multiple methods. For example, our Road Funding Index included a construction cost correction factor to better reflect the purchasing power of each state’s road agencies. The data used to correct for construction costs was considered to be of questionable reliability; thus, this analysis was repeated without adjusting for construction costs. There is a stronger correlation between pavement conditions and funding levels without the construction cost correction factor, but the relationship is strongly negative – suggesting that better-funded states are less likely to achieve better pavement conditions when the analysis does not adjust for construction costs. This helps to validate the methodology of the Road Funding Index and subsequent findings.
Additional support was achieved by specifically evaluating the Interstate system within each state. For this analysis, we pulled capital outlay and maintenance spending data on Interstate routes from 2012 to 2021. The sum of all expenditures was plotted against reported Interstate pavement condition as measured by the federal pavement condition metric (PCM). The modified PCM metric used for this analysis, constructed as the percentage of Interstate pavement reported to be in good condition minus the percentage in poor condition multiplied by a factor of five (to reflect the perceived importance of not allowing pavement to fall from fair to poor condition). The results of this analysis are shown in Figure 2.
Figure 2
Interstate Pavement Condition vs. Expenditures per Lane-mile
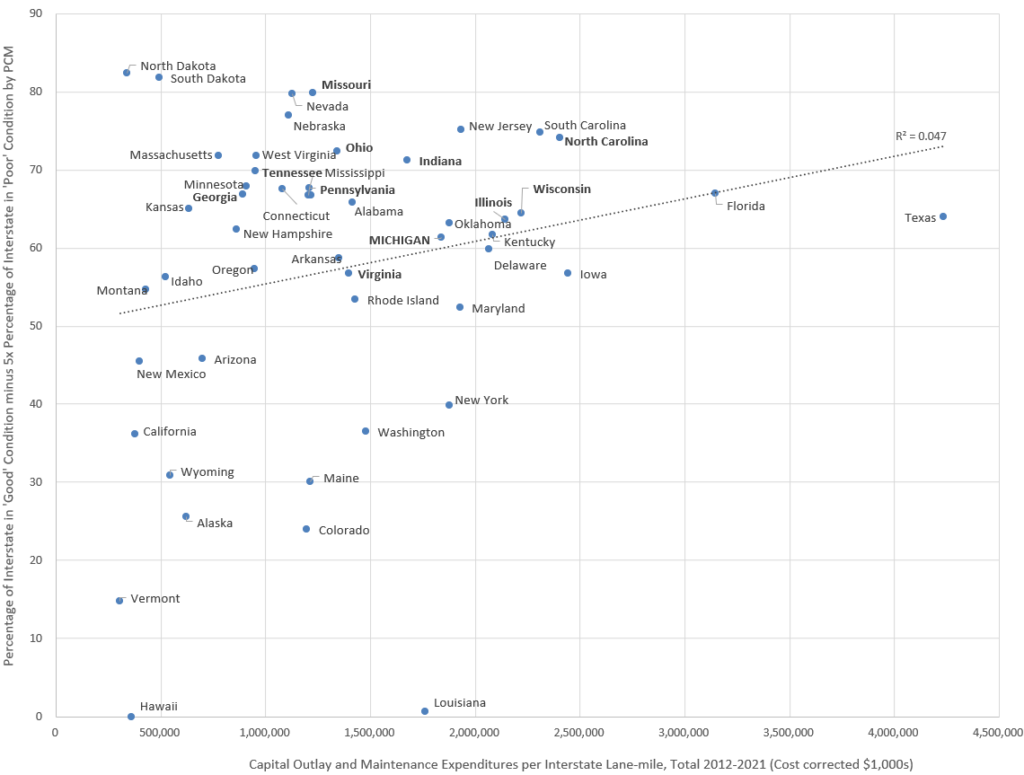
Figure 2 shows a positive relationship between Interstate system condition and expenditures. However, the correlation is weak, as shown by the scatterplot and confirmed by linear regression. We again observe a grouping of states in the upper-left quadrant, supporting the observation that a typical state can achieve relatively good pavement condition with relatively modest funding.
These analyses include multiple caveats regarding data reliability issues and methodological choices, many of which are detailed in the posts regarding both the Pavement Condition Index and Road Funding Index. However, we must consider the possibility that what the data suggests is true: States with more road funding are no more likely to achieve better pavement conditions than moderately funded states.
Figure 3 shows the Pavement Condition Index plotted against the Road Funding Index for only Michigan and peer states.
Figure 3
State Pavement Condition Index vs. Road Funding Index, Michigan and Peer States
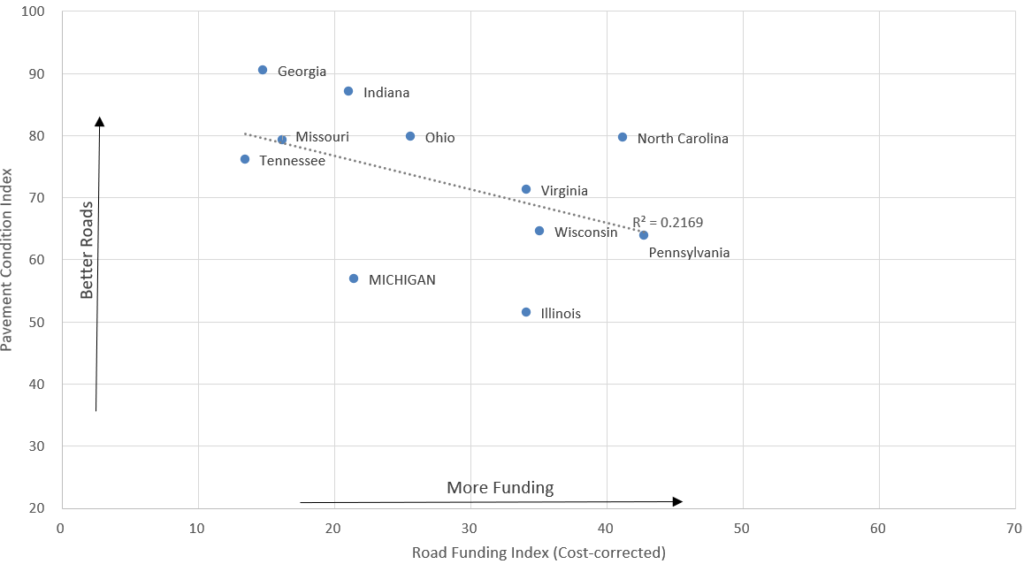
Looking only at Michigan and peer states, we see a stronger negative correlation between pavement condition and road funding than when looking at the 50-state data. That said, the limited sample size makes the correlation quite dependent on each state. While we have attempted to control for exogeneous variables, both through the construction of the indices and by focusing on peer states, the index scores may be influenced by factors that are not captured.
Potential Explanatory Factors
On initiating this research, we expected to find that better pavement condition is correlated to higher funding levels. Available data has been evaluated in multiple ways; all methods employed suggest that there is very little correlation between road funding levels and resulting pavement condition. Here, we explore factors that may partially explain this finding.
Climate
Michigan’s potholes and crumbling roads are often attributed to the state’s wet-freeze climate. Indeed, as frost cycling causes moisture within the pavement to expand and contract as it freezes and thaws, that can impose accelerated pavement surface failure. However, the data shows no obvious relationship between pavement quality and climate across states.
Pavement damage due to climate factors is difficult to quantify and not limited to freeze-thaw cycles. Pavement in southern states is more subject to heat stress and rapid aging due to UV damage. Excessive rainfall can also damage pavement by saturating and weakening the pavement subbase foundation. Even in a wet freeze climate, frost cycling can be managed with appropriate pavement design and maintenance (including of drainage features). It is generally when pavement is already in poor condition that it is subject to accelerated freeze-thaw damage. This is likely a factor in states like Michigan, Illinois, and Wisconsin. However, Ohio is a wet-freeze state and, by some measures, subject to more frequent frost cycling than Michigan. Regardless, Ohio reports significantly better pavement quality than Michigan with only slightly higher funding levels.
Climate alone does not appear to be a controlling factor in states’ ability to efficiently maintain roads.
Road agencies’ winter maintenance practices are another climate-related factor. Deicing chemicals can accelerate pavement aging. Pavement damage from winter maintenance can be mitigated by various methods, such as optimizing the timing, amount, and type of deicing chemicals. Notably, Ohio has embraced the use of liquid salt brine, which reduces the amount of corrosive deicing chemical needed, reducing both pavement damage and environmental impacts. The Ohio DOT now uses less than half the salt on state-controlled roads than it once did. (Michigan has initiated a pilot program to explore alternative approaches to winter maintenance, with results expected in 2025.)
Overall, we find that climate alone is not a controlling factor in states’ ability to efficiently maintain roads. This is a fortunate finding, as states can’t do much about their climate. However, some cold-weather states might improve performance by improving maintenance practices so that water does not infiltrate the pavement surface, monitoring the condition of drainage features, and reducing the use of corrosive ice-melting chemicals.
Distribution of Authority
Each state has a department of transportation with administrative jurisdiction over state-owned roads. However, the miles of state-owned roads as a percentage of the statewide public road network can vary significantly. It is possible that states with a greater percentage of roads delegated to local authorities have difficulty rationally distributing funding and establishing coherent statewide asset management plans. Evaluation of available data provides some support for this.
Table 2 shows the distribution of ownership of federal-aid eligible roads, National Highway System routes, and all public roads for Michigan and peer states.
Table 2
Percentage of System Route Miles Under State Jurisdiction, 2020
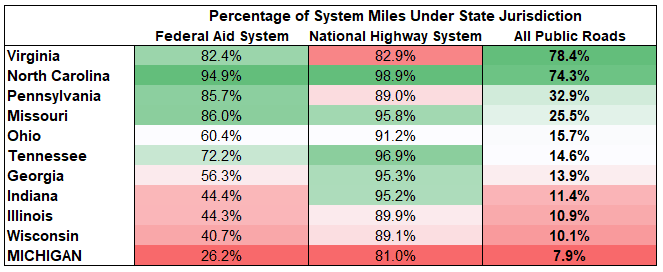
Michigan ranks last among peer states in the percentage under state ownership for all three systems.
Only 7.9 percent of Michigan’s public road network is under the authority of MDOT, ranking 47th nationally. The data used to create the Pavement Condition Index does not cover all public roads but includes all federal-aid-eligible routes. Only 26.2 percent of Michigan’s federal aid system is controlled by MDOT, ranking 48th nationally. The Pavement Condition Index emphasizes conditions on National Highway System (NHS) routes, designated based on national strategic importance (including all Interstates). MDOT owns 81.0 percent of NHS routes, ranking 45th nationally.
Road ownership in Michigan is distributed across 614 county and municipal road agencies.
The remainder of the road networks are owned and operated mainly by local governments (though a small percentage of roads are under federal jurisdiction). Excessive distribution of ownership may preclude attempts at rational planning and achieving economies of scale. In the case of Michigan, road ownership is distributed across 614 county and municipal road authorities. It may be difficult for our revenue distribution formula (Act 51 of 1951) to efficiently match distribution of funding with system needs. Similar issues in Illinois and Wisconsin may also explain the performance gap for these states demonstrated in Figure 3.
System Expansion
Most road agencies express a “fix it first” mantra, whereby maintaining existing roads and bridges is prioritized over adding system capacity. However, states may vary in the extent to which such a policy is reflected in investment decisions. Road agencies often have competing priorities and choose to use funding for things like paving previously unpaved roads, adding new lanes to address traffic congestion, or building new roads to drive economic growth and accommodate greenfield developments. Funding expended on new roads and pavement is not otherwise available to maintain the existing system.
The Pavement Condition Index was constructed using each state’s most recently available pavement condition data, while the Road Funding Index includes funding data from 2012-2021. Comparing these indices to evaluate the performance of road agencies within each state does not differentiate funding that may have been dedicated to new pavement, new roads, or capacity expansions within this time period. Therefore, states undergoing system expansions may partially explain a performance gap.
Available data suggests that a few of Michigan’s peer states have invested significantly in new roads and capacity since 2012, particularly Tennessee, North Carolina, and Missouri. Yet these states do not show a significant performance gap and appear capable of maintaining the overall road system in relatively good condition despite investing in new roads.
Unfortunately, underlying data issues prevent a more thorough evaluation. Issues include a lack of data on miles of paved or unpaved local roads, routes not being reported if they were closed to traffic during the reporting year, the exclusion of “flex lanes” from official reporting of lane miles, and reported changes in system mileage due to reclassification as opposed to any changes to the road itself.
However, it is reasonable to propose that states that are expending funding on new pavement and capacity expansion projects will have less funding available to maintain current infrastructure. Road agencies should consider whether projected revenue will cover the life cycle costs of new pavement before investing in such projects.
Bridges and Tunnels
The Road Funding Index includes a category that attempts to capture additional bridge-related costs. However, the evaluation simply used lane-miles of bridge deck in each state, essentially assuming that all bridges are created equal as far as annualized life-cycle costs are concerned. Additionally, the Road Funding Index did not consider the additional costs of highway tunnels, which are even more expensive than bridges.
If a state has several highway tunnels or large complex bridges that require additional expenses to maintain, this may contribute to perceived poor performance by our evaluation method. Any performance gap related to excessive bridge and tunnel costs does not reflect actual performance but reflects a weakness in the analytical methodology and underlying data. In evaluating Michigan’s peer state performance, this possibility is especially interesting in the cases of Pennsylvania and Virginia. Additional research would be needed to better evaluate the impact of this omission on the Road Funding Index and related findings of performance gaps in comparison to pavement condition.
Historic Urban Centers
Some states may struggle with additional costs related to maintaining roads and bridges in dense historic urban centers. While the Road Funding Index included a construction cost correction factor to account for this, not all costs and complexities may have been captured. This may provide a partial explanation for the poor performance of Michigan (Detroit), Wisconsin (Milwaukee), Illinois (Chicago), and Pennsylvania (Philadelphia and Pittsburgh). That said, Ohio, Missouri, and Indiana also have historic urban areas and appear less impacted.
Looking at the performance of peer states (Figure 3) and national data (Figure 1), states with historic urban areas do appear to have additional challenges to achieve good pavement conditions with their given funding. This may be related to the existence of complex bridges and roadway tunnels in these areas, as previously discussed. If so, this would reflect a flaw in our methodology rather than actual poor performance. Further research is needed to further evaluate this. For now, we can only propose that historic urban areas – particularly those with an industrial history – appear to partially explain the performance gap in some states.
Heavy Truck Traffic
Truck traffic contributes the most to pavement damage and is, thus, the most significant driver of the cost required to maintain pavement. The Road Funding Index accounted for truck traffic by evaluating road funding by truck vehicle miles traveled (VMT) in each state. However, this evaluation method does not account for trucks’ loaded weights, which is pertinent to evaluating Michigan’s performance.
While most states limit loaded truck weights to 80,000 pounds, Michigan allows trucks of up to 164,000 pounds. It is sometimes stated that this additional weight does not cause additional pavement damage because the weight is spread over more axles, thus imposing a lesser equivalent single axle load (ESAL) on the pavement. The truth is more complicated.
The ESAL method can provide a rough estimation of pavement damage from truck traffic but does not account for many factors. Pavement engineers now use a much more robust method of evaluating pavement damage using multiple variables related to truck traffic, culminating in a ‘axle load spectra.’ Michigan’s unique truck weight laws have required MDOT to extensively research how to apply this to pavement design. Michigan’s unique axle load spectra are almost certain to impose more pavement damage and associated costs than states with similar truck VMT.
Considering this, it is likely that the Road Funding Index underestimates the costs associated with truck traffic in Michigan. This may have artificially increased Michigan’s Road Funding Index score and ranking. However, the truck VMT component of the index score was less influential than the three other components due to very low truck VMT in Alaska setting the upper bound of the index and compressing the range of scores in the remaining states.
Regardless, Michigan’s perceived performance gap may be partially explained by the Road Funding Index methodology and the underlying data’s inability to capture the full costs of truck traffic. To a lesser extent, this may also apply to some of Michigan’s peer states, which have partial exceptions to the standard 80,000-pound truck weight limit.
Contracting and Construction Practices
Road agencies are challenged to balance priorities to obtain low bid prices on construction work, minimize traffic disruption during construction, and assure high quality of the final product. Road agencies in different states place different emphases on priorities like material testing, construction inspection, and warranty enforcement. These differences may partially explain the distribution of states’ apparent abilities to achieve better pavement conditions with limited funding. Additional research would be required to evaluate this link further.
Transportation Asset Management
The most critical challenge for any road agency is to determine how to apply and distribute funding for maintenance and operations across the entire roadway system. This process is generally called transportation asset management (TAM). Major construction and maintenance projects are typically planned at least four years in advance. Planners benefit from reliable, meaningful data on pavement conditions, which allows them to forecast pavement quality into the future and apply funding to appropriate projects at an appropriate stage in the pavement’s life-cycle. This is the role of a Transportation Asset Management Plan (TAMP).
All states must now submit TAMPs that cover the statewide National Highway System network, including Interstates and most major roads. However, not all TAM programs are created equal. A review of state TAMPs suggests that every state reports that it is doing the best job it possibly can to make the best use of funding. However, available data suggests that some states are doing better than others.
Different approaches to Transportation Asset Management may be a primary factor in explaining why states with more road funding do not necessarily achieve better pavement quality.
Many details of an asset management program are often not addressed in state TAMPs. For example, the level of cooperation between regional offices of a state DOT and the integration between asset management on state and locally owned routes. Such details can substantially impact the efficiency of road system investments.
TAM provides critical decision support to road agencies making tough decisions about project selection. The metrics and methods used to assess and forecast pavement condition determine the utility of this support. The Federal Highway Administration has mandated that states use a standard pavement condition metric (PCM) to manage the national highway system. However, while states must report PCM and establish performance goals using the metric, states are not required to use it for internal planning purposes, and many do not.
Many states have adopted novel metrics and methodologies for their asset management programs. Planners’ ability to choose project types and locations that most efficiently use available funding hinges on the quality of the pavement condition data and its ability to forecast pavement condition many years into the future.
As shown in Figure 1, about half the states are clustered in the upper-left quadrant of the Pavement Condition vs. Road Funding matrix, suggesting that many states can achieve reasonably good pavement quality with limited funding. Unique circumstances or weaknesses in the analytical method and underlying data may explain some outlier states. However, several states appear to have the potential to perform better with current funding levels.
As shown in Figure 3 for Michigan and our peer states, Georgia, Indiana, Missouri, Tennessee, and Ohio all have road funding levels similar to Michigan but have achieved significantly better pavement conditions. Michigan should look to these peer states for differences in approaches to asset management that could be used to improve Michigan’s investment decision support provided by TAM. The differences in approaches to TAM may be a primary factor in explaining why states with more road funding do not necessarily achieve better pavement quality.
Summary and Discussion
We have conducted rigorous analysis of road funding and pavement condition data for all 50 states. While not intuitive, we found substantial evidence that pavement condition and funding are not well correlated. In other words, higher funding levels for a state provide little reason to expect better pavement.
Michigan road interests have long sought to address road quality issues by obtaining additional revenue and funding. The legislature has even directed multi-million dollar research projects to investigate new approaches to revenue generation. In 2020, $3.3 million was appropriated to research the feasibility of a Michigan tolling system. The subsequent report was made public in 2023 but is unlikely to provide any actionable solutions. The legislature recently appropriated $5 million to explore road usage charging (RUC). This, too, is unlikely to result in any actionable solutions.
In 2023, an industry-funded study concluded that Michigan’s road funding “gap” is nearly $4 billion annually. Addressing this gap would require essentially doubling the current amount of state revenue dedicated to roads and bridges. Yet Michigan is not an obviously underfunded state. Using revenue and expenditures data from 2012-2021, we find that Michigan ranks 30th nationally in road funding, with funding levels similar to states like Ohio and Indiana. When calculating a gap of $4 billion, the study authors used data and advice from Michigan’s road builders. An assumption was embedded that every road agency within the state is making the most optimal investments in high-quality work, and there is no room for improvement.
Data suggests that there is room for improvement. Michigan may be able to improve road conditions without huge influxes of new funding. This should be earnestly considered.
Michigan should appropriate funding for research that evaluates the efficacy of the state’s ability to utilize available funding to achieve a high-quality transportation system.
It is appropriate that Michigan is exploring options for new revenue streams. Certainly, there are concerns with future road revenue. As vehicles become more efficient and electrified, fuel tax revenues are likely to plateau and eventually decline under current policies. However, the legislature should also explore the potential to do better with existing funding.
Michigan should appropriate money for a thorough engineering-quality research effort that evaluates the efficacy of the state’s ability to utilize road funding to achieve a high-quality transportation system. Specific issues that should be evaluated include the following:
- The effectiveness of the state road funding distribution formula, Act 51 of 1951, in matching funding allocations with system needs.
- The efficiency of vesting road responsibilities in 614 road agencies and the potential benefits of charging the state highway department with responsibility for larger shares of the road network
- Winter maintenance practices and the pavement damage costs associated with deicing chemicals
- The life-cycle costs and benefits associated with new pavement, new roads, and capacity expansion projects
- Costs associated with Michigan’s unique truck weight laws
- Quality assurance and quality control practices such as material testing, construction inspection, and warranty enforcement
- Transportation Asset Management approaches in Michigan, including the ability for current metrics to accurately forecast pavement condition
A study that provides actionable advice to improve the efficiency of Michigan’s road agency operations could pay back hundreds of millions of dollars annually. To borrow an old idiom, ‘We’re all out of money; it’s time to start thinking.’
Primary author: Eric Paul Dennis, PE – epdennis@crcmich.org
Related Posts
Michigan Ranks 40th in Road Pavement Quality Assessment, April 2024
Michigan Ranks 30th in Road Funding Assessment, June 2024
Identifying Michigan’s Highway Infrastructure Peer States, January 2024
Fix the Damn Road Funding Formula, February 2022
