June 9, 2026
In a nutshell:
- In the past 50 years, Michigan has experienced at least five periods of economic contraction, including the current COVID-19 induced recession.
- The only recessionary period that saw extended, severe drops in property values and their associated tax revenues was the Great Recession (2007-2009). If history repeats itself, Michigan can expect property values and tax revenues to remain fairly stable.
- Although there is plenty of room for improvement in Michigan’s broken municipal finance system, the reliability of the local property tax during most economic recessions should not be dismissed and may provide local governments with one stable revenue source during this period.
The COVID-19 pandemic has largely shut down the Michigan economy and sent the state spiraling into an economic recession. Reviewing property value and revenue data from previous recessions can help us to understand the potential impact this one might have on local property tax revenues. A quick look at the data illustrate that, for the most part, property values and tax revenues remain fairly stable during economic downturns.
Although past performance is not an indicator of future success (to paraphrase our investment advisors), we think the Great Recession was an exception because of the strong ties of the financial crisis to the real estate market. During the COVID-19 recession, we expect that the property tax system will perform as it did during previous downturns.
Michigan recessions since 1970
Looking at economic data over the past 50 years, Michigan has experienced at least four separate periods of fairly severe economic contraction:
The 1973 to 1975 recession, often referred to as the first oil crisis, reflected the convergence of two forces: the postwar recovery of Japan as a competitive threat to Detroit’s big three automakers, and the petroleum embargo enacted by the oil cartel nations in the fall of 1973. Oil prices quadrupled overnight and the nation succumbed to a recession lasting 16 months, with U.S. unemployment levels peaking at nine percent.
The 1980s started with a six-month mini-recession from January to June 1980, which was followed by a 16-month recession from July 1981 to November 1982. During this period, U.S. unemployment levels peaked at 10.8 percent while Michigan’s were nearly double that. Real personal incomes in Michigan fell 12 percent and by the time the recovery came, Michigan’s purchasing power had fallen from 6.6 percent ahead of the national average to 3.7 percent behind it.
After a mild eight-month national recession that started in March 2001, Michigan fell into a single-state recession that lasted much of the following decade. It started sometime in mid-2002 and was signaled by a disruption in employment recovery. Employment and job losses in Michigan did not show signs of stabilizing until 2007. Between 2000 and 2009, Michigan ranked last in the nation on population growth, real per capita gross domestic product, and employment. Michigan also became poorer relative to other states during this period, as its per capita personal income national ranking fell from 19th in 2000 to 41st in 2009.
Michigan’s recovery from its single-state recession came just in time for the state to succumb to the Great Recession of 2007 to 2009 that embroiled the whole country in its most severe economic downturn since the Great Depression. The nation experienced peak unemployment of 10 percent and a decline of 4.3 percent in overall production. However, the fallout in Michigan was much worse due, at least partially, to the decline of Detroit’s big three automakers’ share of the market and profits. Both General Motors and Chrysler filed for bankruptcy. The housing market in Michigan and the nation collapsed; total housing permits issued in Michigan fell 88 percent from 2004 to 2009 and the corresponding value of housing starts fell from $7.6 billion to $1.2 billion.
Michigan experienced 15 percent unemployment, bankruptcies across industry lines, net population loss, and a record number of foreclosed properties. The Great Recession was caused, at least in part, by a housing bubble that led to inflated and unsustainable housing prices. The bundling of subprime mortgage securities spread the economic collapse beyond the mortgage-lending industry.
Property tax revenues during an economic downturn
All local governments in Michigan rely on property tax revenues to some extent, and, for most local units, they make up a majority of local own-source funding. One benefit of a heavy reliance on property taxes is that they tend to be much more stable than other types of taxes, including sales and income.
Chart 1 shows the percentage yearly change in state equalized value (SEV) from 1970 and the percentage yearly change in taxable value (TV) since 1995. This reflects changes in the assessed values that property taxes are levied on.* As Chart 1 shows, property values fell slightly in the mid-1970s due to the recession and were around zero percent growth during the 1980s recession. They continued to grow during Michigan’s single state recession, though at lower percentages than in previous years. The only recession that saw extended, severe drops in property values was the Great Recession, which was precipitated by the housing market crash.
Chart 1: State Equalized Value and Taxable Value Percent Change from Previous Year

Source: Michigan Department of Treasury
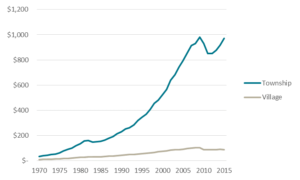
Chart 2 shows the actual growth (and sometimes decline) in SEV and TV since 1970. Again, with the exception of the Great Recession, property values stabilized during the recessionary periods, but did not show large declines.
Chart 2: Property Values in Michigan (in millions)

Source: Michigan Department of Treasury
But let’s take a look at what happened with property tax revenues during the recessionary periods. Chart 3 shows two major declines in total state and local property tax revenues in nominal, or current, dollars: one when Proposal A was enacted in 1994 (no surprise – part of the impetus behind Proposal A was to lower property taxes) and the second was during the Great Recession. Charts 4 and 5 focus on local property tax revenues and show largely the same thing – property tax revenues remained fairly stable through all recessions except for the Great Recession.
Chart 3: Total State and Local Property Tax Revenues (in millions)

Source: Michigan Department of Treasury
Chart 4: City and County Property Tax Revenues (in millions)

Source: Michigan Department of Treasury
Chart 5: Township and Village Property Tax Revenues (in millions)
Source: Michigan Department of Treasury
The 2020 COVID Recession
So, what does this historical data tell us to expect moving forward? If history repeats itself with this recession, Michigan local governments can expect property tax values to remain fairly stable, at least initially.
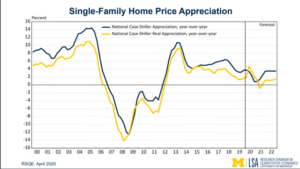
Chart 6 shows the projected single-family home price appreciation at the national level through 2022; it shows that home prices have been stable for the past five years and are projected to remain fairly stable. We do not see large increases creating a bubble like in the early 2000s before the housing market crashed. Prior to the COVID-19 pandemic, low inventory combined with low mortgage costs was contributing to price increases. The forecast shows that appreciation will slow dramatically and the housing market will take a hit as economic fears grow, but these projections do not show large decreases in home values. This is partially due to measures in place to suspend home foreclosures and allow for delayed payments in the short run.
Chart 6: Single Family Home Price Appreciation
While past recessions saw high unemployment (though maybe not as high as we are currently experiencing) and sometimes long periods of economic contraction, property values and tax revenues tended to remain stable. Growth may have slowed or stopped, but most recessions did not see large declines in property tax revenue. Unless this pandemic has a long-term impact on real estate markets, it is unlikely to have a great effect on property tax revenues. That said, these revenues could be impacted in the short term, should people and businesses be unable to pay their taxes due to unemployment or business closure.
Proposal A, and the change to TV from SEV, has created something of a bubble that can insulate property tax revenues during periods of decline. Here’s how it works: SEV (linked to market value) can be quite a bit higher than TV (linked to inflationary growth). After the housing crash of the Great Recession, property values have largely recovered, leading to growth in SEV. During that same period, the TV that homeowners pay property taxes on has grown only by inflation.
According to the Southeast Michigan Council of Governments (SEMCOG), the ratio of TV to SEV is 78 percent in Southeast Michigan, meaning that 22 percent of property value is untaxed due to the Proposal A cap.
This gap may not be 22 percent across the state, but it still exists and provides room for property tax revenues to grow while property values decline. If we experience real declines in property values, the associated revenues will not decline until TV and SEV meet. If we look back up at Chart 2, we can see that TV grew much more slowly than SEV. This is visual evidence of the bubble created and the reason that property tax revenues can increase even when property values decline.
Although the Citizens Research Council has long held that the property tax alone is an insufficient revenue source for local governments and there is plenty of room for improvement in Michigan’s broken municipal finance system, the ability of local governments to rely on property taxes during recessionary periods should not be overlooked.
The data discussed in this post reflect statewide trends. Data at this level may obscure wider variation at the county or municipal levels. For the most part, we do not expect property values or tax revenues to follow the pattern of the Great Recession, but some individual performances may do worse than others.
* Until 1995, property tax rates were levied on SEV, which is 50 percent of the true cash value of each property. Proposal A of 1994, in addition to changing the school finance system and lowering property taxes for many Michigan residents, created TV as the basis that property taxes are levied on. TV equals SEV when a property is purchased, but a property’s value for tax purposes can only grow by five percent or the rate of inflation as long as a person owns it (inflation, and therefore TV, has been less than five percent every year since 1994). When a property is sold, it reverts back to its SEV level.
