June 9, 2026
In a nutshell
- Property taxes represent a large tax burden in Michigan and across the U.S. For most local governments in Michigan, property taxes are their sole source of local tax revenue.
- The property tax burden in Michigan has gone from being above the national average in 1978 to below it by 2018. Despite this, the burden as a percent of personal income in Michigan has been relatively stable across the years.
- Since the property tax burden has remained stable even with the adoption of limitations to the tax base, it suggests that local governments have responded by increasing the tax rate over the years.
Property taxes are something that everybody loves to hate. For taxpayers, they represent the largest tax burden most people face, despite the multiple tax limitations enacted over the years. For local governments, the tax represents a critical revenue source to fund services, but one that struggles to provide enough revenue, on its own, to fully meet all local needs.
Property taxes in Michigan
Property tax revenues play a critical role in funding local government services across the United States. In 2018, property taxes were the largest own-source local government revenue stream (71.7 percent of all local tax collections) and accounted for the largest share (31.1 percent) of all public revenue collected by state and local governments.
Michigan local governments are heavily dependent on the property tax and the state levies a property tax as well. The Tax Foundation ranked Michigan as having the 13th highest property taxes in 2020 with an effective property tax rate of 1.44 percent of a home’s value (highest was New Jersey at 2.21 percent and lowest was Hawaii at 0.30 percent).
Property taxes in Michigan are the main local-source revenue option for all types of local governments from cities and townships to counties, school districts, and special districts. Twenty-four cities levy income taxes and counties levy some minor taxes (e.g., real estate transfer and tourism-related), but for the rest of Michigan’s local governments, property taxes are their sole source of tax revenue.
The property tax is also widely disparaged because it is the only tax where the amount due is not easily understood or controlled by the taxpayer. Taxpayers know what the tax rate will be on their income earned and on each purchase they make, but they cannot control the assessment process or how much their property will be valued for, which is what determines how much taxes are owed.
It is also disliked because it is paid in two lump sums, a winter and a summer levy. Whereas income taxes are withheld from each paycheck and sales taxes are paid as a percent of each transaction, the two large bills taxpayers face each year shine a bright light on the property tax burden.
This onerous payment method and lack of predictability in property taxes owed has contributed to the passage of limits on yearly assessments and yearly revenue growth.

Tax burden over time
Michigan’s property tax burden over time can be difficult to measure because of the major changes to the tax in the 1990s with the adoption of Proposal A. Proposal A created a modified acquisition value system for determining the taxable value of a property. Before Proposal A, property value for taxation purposes fluctuated with the market; after Proposal A, growth in taxable value was limited to inflation unless a property was sold, at which point it would revert to market value. Proposal A also eliminated local property taxes for school operating purposes, and by doing so, lowered the tax burden substantially. (It must be noted that these local taxes were replaced with increased state taxes to fund schools.)
Table 1 below shows that the total local property tax burden in Michigan went from being above the national average at 33.1 percent of total local revenue and $1,287 per capita in 1978 to below it in 2018. The adoption of Proposal A decreased local property taxes in support of schools. Proposal A also instituted taxable value, which is represented by the tan line in Chart 1 and grows much more slowly than market value.
However, when looking at property tax revenue data, revenue grew 49 percent in Michigan compared to 66 percent nationally from 1995 to 2018. Local property taxes were $1,621 per capita nationally in 2018 and only $1,248 per capita in Michigan.
Table 1
Michigan and U.S. Local Property Tax Burden, 1978 to 2018
| Property Taxes in Michigan as Percent of Total Local Revenue | Property Taxes Per Capita in Michigan | Property Taxes as Percent of Personal Income in Michigan | Property Taxes in U.S. as Percent of Total Local Revenue | Property Taxes Per Capita in U.S. | Property Taxes as Percent of Personal Income in U.S. | |
| 1978 | 33.1 | $1,287 | 3.8 | 29.9 | $1,111 | 3.5 |
| 1985 | 35.9 | $1,402 | 4.1 | 24.8 | $ 979 | 2.8 |
| 1990 | 36.3 | $1,505 | 4.1 | 25.9 | $1,153 | 3.1 |
| 1995 | 19.5 | $ 864 | 2.2 | 25.6 | $1,200 | 3.1 |
| 2000 | 21.4 | $1,142 | 2.6 | 23.5 | $1,231 | 2.8 |
| 2005 | 24.6 | $1,377 | 3.3 | 24.8 | $1,412 | 3.1 |
| 2010 | 26.4 | $1,422 | 3.5 | 26.3 | $1,599 | 3.4 |
| 2015 | 24.7 | $1,241 | 2.7 | 26.6 | $1,550 | 3.0 |
| 2018 | 24.7 | $1,248 | 2.6 | 26.3 | $1,621 | 3.0 |
Note: Dollars in real 2018 dollars, adjusted for inflation.
Source: US Census Bureau Annual Survey of State and Local Government Finances, 1977-2018 (compiled by the Urban Institute via State and Local Finance Data: Exploring the Census of Governments; accessed 30-Jul-2021 03:28)
Chart 1
Market Value, Taxable Value and State Average Tax Rates, 1978 to 2020
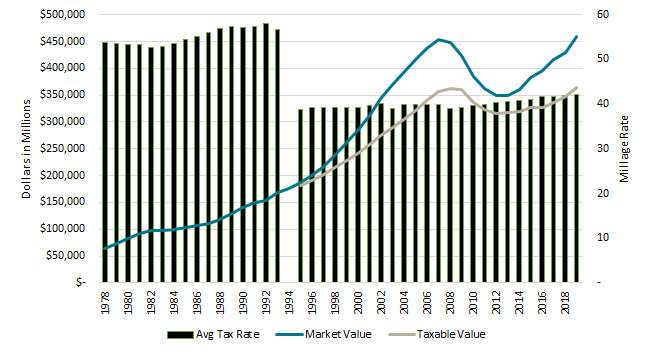
Source: Michigan Department of Treasury
Taking an even closer look at Michigan-specific data, we can remove school taxes from the equation to see how the county, city and township tax burden has changed over the years. Chart 2 shows that the statewide non-school local property tax burden has been stable at roughly 1.3 to 1.5 percent of personal income since 1978 with increases during recessionary periods when personal income grew more slowly (or declined as it did during the Great Recession from 2007 to 2009).
Chart 2
Michigan Non-School Local Property Tax Levy as Percent of Personal Income
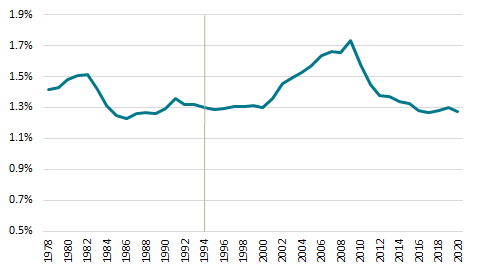
Source: U.S. Bureau of Economic Analysis and Michigan Department of Treasury
Property tax burden has been stable despite changes
We can piece together this information to draw several conclusions.
First, since 1994, property taxes have contributed less to the funding of government in Michigan than they do nationally. The property tax burden in Michigan is less than the national average.
Second, the burden has remained stable even with limits on the growth in assessments that were instituted with Proposal A and the Headlee Amendment limits on the tax levy. The fact is that the Proposal A and the Headlee Amendment tax limitations have restrained the tax base, but the years following adoption of Proposal A in 1994 saw no real change in burden relative to income, which suggests that something else is at play.
Third, pressure on the tax base has led to increases in the tax rate in order to keep the tax burden stable. Chart 1 shows a slow, but steady increase in the average tax rate from 1995 to 2020.
