
July 6, 2026
In a Nutshell:
- Recent research suggests that displaying certain messages on dynamic message signs (DMS) increases the crash rate.
- Current DMS investment and operations strategies are based on historical assumptions of traffic impact that are not validated by empirical data.
- The Michigan Department of Transportation should reassess DMS policies to assure an overall benefit to the travelling public.
By: Eric Paul Dennis, PE – epdennis@crcmich.org
How often do you notice dynamic message signs (DMS)? This is the technical name for those big permanent digital signs along the highway. State transportation departments (DOTs) have used these signs for decades to provide information to highway users. Typical messages warn of congestion, weather-related hazards, or generally advocate safe driving.
Displaying the current fatality rate on DMS actually increases the risk of further crashes and fatalities.
The Goal of DMS: Improve Traffic Efficiency and Safety
The benefits of DMS are often broken-down into two basic categories:
Traffic Efficiency: DMS can provide information about traffic disruptions on the road ahead, travel-time information, and in some cases re-routing and detour recommendations. It is assumed that by providing this information, drivers will be able to optimize trip and routing decisions, decreasing congestion and improving efficient operation of the overall transportation system.
Traffic Safety: DMS is often used in traffic safety campaigns. Sometimes the message may be a general warning such as reminders to buckle up or obey the speed limit. Sometimes the message pertains to road conditions, such as warning of blowing snow or icy roads ahead. The hope is that drivers will heed these warnings and make safer driving choices, decreasing the overall traffic crash and fatality rate.
The discussion herein will focus on the safety impacts of DMS.
From the mid 1990s until about 2010, traffic deaths gradually declined in Michigan and in the United States generally. However, in the last decade, the safety improvements have plateaued, and by some measures have regressed. In 2020, there were 1,083 listed traffic deaths in Michigan, the most since 2007.
Official Count of Traffic Fatalities in Michigan (2011 – 2020)

The recent uptick in traffic fatalities has stimulated a resurgence of interest in traffic safety. Most discussion has centered on driver behaviors such as distraction due to smartphone use and driving under the influence of alcohol or drugs. Others note that over this time period, new vehicles have generally gotten larger and faster, making the vehicle itself a higher risk.
Another factor that is becoming popular as a research topic is the effects of transportation infrastructure itself, including speed limits, road geometry design, and even roadside features such as DMS.
Although nearly every state has adopted DMS to some extent, very little is known about how drivers respond to these roadside messages. DOTs assume that drivers use the DMS information appropriately, but the real world effects of DMS have rarely been assessed empirically with much confidence. And, according to the little evidence-based research that is available, it appears that messages could backfire and do more harm than good.
Safety Messages and Crash Rates – Recent Research Findings
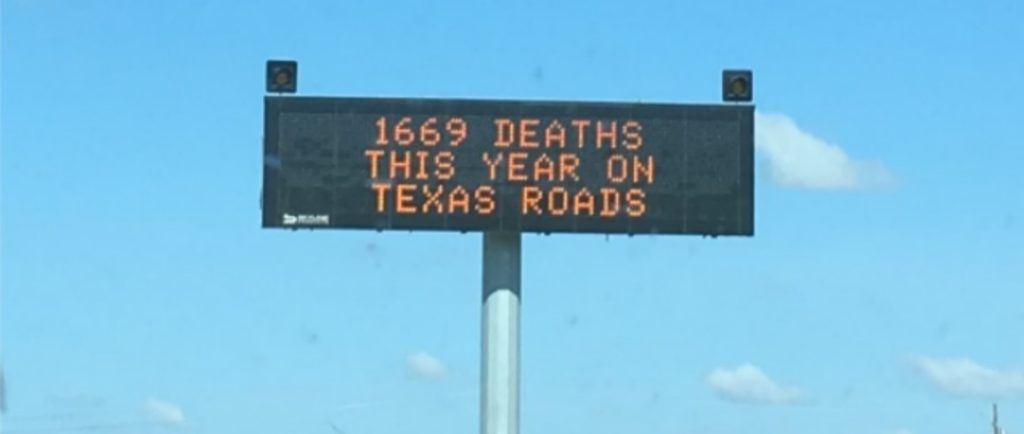
One of the common uses of DMS is to inform drivers of the number of traffic fatalities that have occurred in a state. You may have seen such a message along the lines of, “440 TRAFFIC DEATHS IN MICHIGAN THIS YEAR.” The hope is that by making the risk of driving more salient, drivers will drive more carefully.
However, an article recently published in the journal, Science, shows that displaying the current fatality rate on DMS actually increases the risk of further crashes and fatalities.
The researchers were able to assess the impact of fatality rate messages due to a unique practice used by the Texas DOT whereby DMS across the state display the annual statewide traffic fatality rate for exactly one week every month (the week of the Texas DOT Board of Directors monthly meeting). This provided a natural experiment that allowed researchers to determine the impact of this message. From the study’s abstract:
“We found that displaying fatality messages increases the number of traffic crashes. Campaign weeks realize a 1.52% increase in crashes within 5 km of DMSs, slightly diminishing to a 1.35% increase over the 10 km after DMSs. We used instrumental variables to recover the effect of displaying a fatality message and document a significant 4.5% increase in the number of crashes over 10 km.”
In other words, this “safety campaign” caused an additional 2,600 crashes and 16 fatalities per year in Texas alone. Clearly, a result the Texas DOT did not hope for with its adoption of DMS technology.
DMS in Texas Displaying Annual Death Count
Another study using data from Virginia finds evidence that any message displayed on a DMS increases crash risk, and that the lowest imposed risk is simply leaving the sign off. While this finding was not statistically significant with 95 percent confidence, the crash risk from messages that require two “pages” to display increases by about 9 percent with statistical significance in the segment following the DMS. (The fatality rate messages from the aforementioned Texas study were also alternated with various safety messages.)
The author concludes that 1.5 percent of all traffic crashes in Virginia may be attributable to multi-page DMS messages, resulting in about a dozen extra deaths each year.
A study by Michigan State University attempted to empirically determine the impact of DMS safety messaging within Michigan. The results hint that certain types of messages may have a positive effect in certain situations, however the overall impact of DMS safety messaging was not clear. From the report:
“The results did not show significant differences with the respect to total or nighttime crashes based upon the frequency of pertinent safety messages… The frequency of DMS safety messages has virtually no relationship with the total number of crashes.”
The Michigan research was somewhat stymied because the available historical data regarding both DMS messages and traffic behavior was not structured to assess the impacts of DMS messaging. There was some utility in the data but it was not ideal for research purposes. The final report noted that, “a study to effectively ascertain safety impacts of DMS messages is challenging for several reasons,” including data unavailability and “confounds that are difficult to control for.”
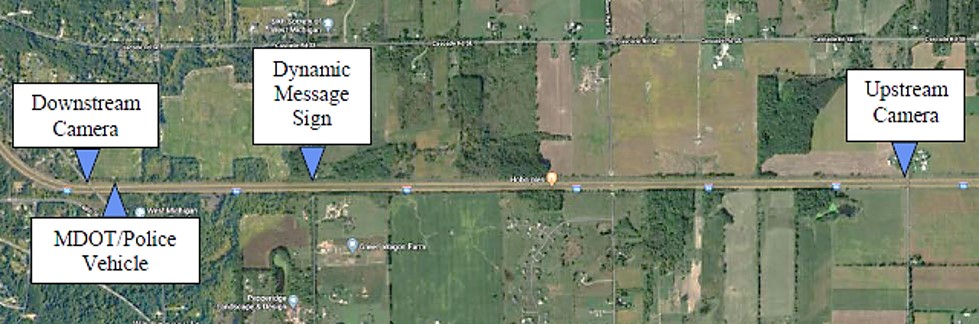
The researchers attempted to account for such statistical confounds by constructing a field experiment where a DMS provided a message to “MOVE OVER AND SLOW DOWN FOR EMERGENCY VEHICLES” immediately preceding an emergency vehicle stopped on the shoulder with lights flashing. The road was instrumented with sensors to capture speed reductions and percentage of drivers merging into the left lane. This data was to be used as a proxy for safety benefits.
Some message types actually seemed to induce drivers to speed up as they passed the MDOT vehicle.
Even in this tailor-made intervention scenario, there was almost no change in driver behavior compared to the baseline scenario – in which the DMS displayed travel time information.
The major exception was when a police vehicle was on the shoulder and the DMS stated, “MOVE OVER AND SLOW DOWN FOR EMERGENCY VEHICLES | $400 FINE.” Otherwise, the DMS message impact on driver behavior preceding a police vehicle was negligible.
The study also tested driver responses to an MDOT maintenance vehicle parked on the shoulder with lights flashing. Again the effect of DMS was negligible, and some message types actually seemed to induce drivers to speed up as they passed the MDOT vehicle.
Michigan State University Study Field Experiment Setup
Takeaways
It is notable that after decades of DMS installations across the country and in Michigan, traffic engineers have very little idea what effect they have on individual drivers or the traffic network as a whole. Most DMS studies are based on driver surveys, simulations, or simply assumptions that are never empirically verified. The empirical evidence-based data that exists has not validated previous theory-based studies and assumptions.
DOTs should also recognize that the context of driver behavior is changing. Many drivers have access to personalized real-time information through dashboard messaging or smartphone apps. DMS messaging may be superfluous or even confounding to drivers.
It no longer makes sense to install and operate DMS signs based only on assumptions that they have a positive impact.
The costs of DMS installation and operation can vary quite a bit, but a review of project databases suggests that a typical DMS costs in the neighborhood of $25,000/year, annualized over the service life of the hardware. Some back-of-envelope math estimates that MDOT is spending about $5 million each year on its network of about 235 DMS. This is a tiny percentage of MDOT’s overall budget, but as new evidence suggests these signs may actually be increasing the crash rate, DMS planning and operations deserves a thorough review.
The DMS budget may be better reallocated to alternative methods that achieve better results at lower cost. For example, dedicated travel time signs can provide travel time data at a significantly reduced cost. Portable message signs can also play a valuable role in driver messaging; these can be more effective than permanent signs when strategically located near construction zones or other events to provide drivers with pertinent, actionable information.
Portable Message Signs and Travel Time Signs are two lower-cost alternatives to DMS and are less likely to impose unintended consequences.

It is likely that DMS should continue to play a role in traffic management, but that role should be reconsidered.
DOTs could take the time to deploy and operate DMS such that valid experimental data is collected as to inform effective use. The authors of the Science article were able to glean meaningful conclusions because the Texas DOT happened to operate DMS messaging with a set routine for a sustained basis. This doesn’t need to happen by accident. DOTs could collect better data that would allow them (or other researchers) to directly measure the impact of various messages in different locations and over extended periods of time. Further, DMS installations are typically planned years in advance, creating the opportunity to begin collecting baseline data before the sign is even installed.
It no longer makes sense to install and operate DMS signs based only on assumptions that they have a positive impact. We now have the ability to collect and analyze traffic data that would allow for confident evidence-based assessment of the impact of DMS and various messages. MDOT and other DOTs should start now by making sure that good data is collected to allow for efficient, strategic investments in the future.
