July 28, 2026
In a Nutshell
- The availability of new school-level spending data for every Michigan school district presents an opportunity to examine how districts allocate their financial resources among the individual schools they operate. Our intradistrict analysis of the new per-pupil spending data uses a novel approach to assess whether individual districts are funding their schools “equitably” – in other words, are schools with higher concentrations of low-income students receiving proportionally more per-pupil resources.
- We found patterns of equitable per-pupil state/local spending in only 55 percent of schools within the state’s 25 largest districts. When we examined total spending (including federal funds), we found that only 57 percent of schools showed patterns of equitable resource allocation.
- Our initial analysis of school-level spending suggests that while state policymakers may be funding districts more equitably across districts through increased state appropriations targeting high-need, low-income students, those additional resources may not be making it to the individual schools those students attend.
New federal K-12 education data reporting requirements make possible analysis of school-level per-student spending across Michigan’s 800-plus local school districts. Previously, only district-level financial information was available for analysis.
Our examination of the new school-level spending data from a sampling of state’s largest traditional public school districts, as well as those districts with the largest proportions of high-need students, found that many districts are not funding their individual schools equitably – schools with higher concentrations of low-income students receive proportionally more per-pupil resources. We found patterns of equitable per-pupil state/local spending in less than 60 percent of schools sampled. That means more than 40 percent of schools included in our analysis exhibited per-pupil spending levels that fell outside of the amount considered to be equitable for the percentage of low-income students schools enrolled.
As the governor and state lawmakers look to increase the amount of state K-12 funding to districts that educate greater proportions of “at-risk” and other high-need learners, our intradistrict school-level spending analysis suggests that those additional resources may not make it to the individual schools where those students attend. That is because school-level resource allocations are a function of several local decisions, not state funding formulas. To ensure state funding policies are carried through and targeted funding is reaching high-need schools/students, Michigan may have to consider creating additional financial transparency and accountability provisions tied to its future K-12 student equity investments.
Michigan may have to consider creating additional financial transparency and accountability provisions tied to its future K-12 student equity investments.
Background
Recent Michigan K-12 education budgets are giving greater priority to programs and services designed to address the added learning needs faced by many students. To this end, over the last six state budget cycles total funding to support “at-risk” students nearly doubled from $500 million to about $1 billion, including a massive $200 million increase in the Fiscal Year (FY)2024 School Aid budget. Another substantial increase is slated for the FY2025 budget currently under consideration by state lawmakers. State “at-risk” funding flows to districts on a per-student basis to use for extra educational support to aid students who are statistically more “at risk” of not completing high school. “At-risk” students include those that are low-income (qualify for free/reduced-price lunch), English language learners, or meet other criteria.
With greater sums of state resources now flowing to those districts serving students with the greatest educational needs, it is not clear whether these resources will make it to the individual schools where those students are enrolled. That is because state school aid flows to districts, not the individual schools they operate.
Allocations to individual schools are a function of various decisions made at the district level, not through the annual School Aid Budget or a federal funding formula. Elected and appointed local school officials must decide staffing levels for each school, salaries paid to teachers working in a school, which programs to offer in particular schools, and the additional educational support provided in each building to address students’ needs.
Historically, public tracking, collection, and reporting of the data related to these school-level financial decisions did not exist – Michigan state laws required financial data reporting at the district level, but nothing comprehensive at the school level. That changed with the reauthorization of the main federal education law. Beginning with the 2018-19 school year, the 2015 updates to the federal Elementary and Secondary Education Act (ESSA) require every district to report annual school-level per-pupil spending by funding source.
The availability of this data presents an opportunity to examine how districts allocate the financial resources received from various sources among the individual schools they operate. In effect, the new spending data allows for intradistrict comparisons, whereas the district-level data only allowed for interdistrict comparisons. Intradistrict analysis of this data can help reveal whether targeted state resources are reaching the students within districts that have the greatest academic needs. This is particularly relevant considering policymakers’ increased focus on equitable school funding.
Our intradistrict per-pupil spending analysis uses a novel approach to assess whether individual districts are funding their schools equitably. We do this by investigating whether districts are allocating more resources per student to schools that enroll higher percentages of low-income students relative to the average school within the district.
For example, let’s imagine a district with three elementary schools that enroll the same number of students. Low-income students make up half of School A’s enrollment; 40 percent of School B’s enrollment; and 30 percent of School C’s enrollment. Equitable funding within the district would suggest the per-student allocation be higher-than-average at School A and lower-than-average at School C, recognizing to some degree the differential in students’ educational needs across the district’s three schools.
The New Data
Thanks to ESSA, states must now annually report for every public school the total per-pupil spending disaggregated by source of funds (combined “state/local” and separate “federal” categories). States break down the information into “site-level” and “district wide” expenditures. Expenditures accounted for at the school site include at a minimum the actual salary and benefit costs of the school site’s full-time staff. The latter category reflects any shared expenditures accounted for at the district level (e.g., pupil transportation, food service) and allocated among all students in a district on an equal per-student basis. Combined, the two categories of spending represent the total public funds expended on behalf of students at a particular school.
Data from the 2018-19 school year was the first information publicly available. Michigan requires certain expenditure functions to be reported at the school level, while districts have the discretion to include other expenditures at the school level. This was designed to provide some uniformity in reporting without being too prescriptive. School-level spending for districts is reported on a public website and in raw data files.
While 2022-23 school year data is now available, our analysis intentionally focuses on the 2018-19 school year as it was the last full year before the onset of the COVID-19 pandemic and the influx of massive amounts of federal relief funding. This provides a “baseline” picture of school-level funding equity in Michigan. Further, this earlier period does not include the most recent substantial increases in state “at-risk” funding (discussed above). Future analyses of more recent data will shed light on how Michigan districts allocated these additional state funds among schools and whether it was done equitably as state policymakers intended.
We use the “site-level” data set in our analysis to focus on the spending that occurs closest to student learning; this site-level spending excludes the “district-wide” portion of spending that presumably benefits all students equally. Our analysis then focuses on whether districts provided equitable funding across their schools, as opposed to “equal” funding. In other words, did districts provide additional marginal financial resources to their schools with the greatest proportions of students with unique learning needs. In addition, we look at spending by funding source – state/local and total (includes federal grants). We have a particular interest in differences in state/local per-pupil spending as these are the dollars available to districts that state policymakers have direct control over either through the annual state-aid appropriation or by granting schools local taxing authority.
Did districts provide additional marginal financial resources to their schools with the greatest proportions of students with unique learning needs?
Also, we limited our analysis to the state’s largest districts based on their total student enrollment. This ensured that we captured a subset of districts where resource allocation decisions involved a meaningful number of schools – at least 10 schools.
Finally, we exclude smaller schools (fewer than 200 students) within the selected districts because they tend to provide more “specialized” programming, such as standalone special education facilities. Higher per-pupil spending in these smaller schools is likely driven by special education enrollment, not necessarily the percentage of low-income students enrolled. We combined our intradistrict results for two separate groups of large districts – the 25 largest districts, regardless of the proportion of low-income students enrolled, and the 15 largest “high-poverty” districts (where low-income students make up at least 50 percent of total district enrollment).
Intradistrict Spending Analysis
Because we are interested in school-level resource allocation, we examine how each school compares to its parent district in terms of student poverty and building-level per-pupil spending. This way the district average becomes the benchmark against which each school is analyzed. We also focus on larger districts where local officials have to make financial decisions across multiple schools that likely have substantially different enrollment demographics, including variations in the percentage of low-income student enrollment.
Our novel analysis involves calculating three separate ratios for each individual school of interest. The first ratio accounts for the percentage of students enrolled in a school that are identified as “economically disadvantaged” (ED) relative to its parent district’s ED student percentage. This captures the reality that student demographics often vary on many dimensions and low-income students may not be evenly distributed across a district’s schools. A computed ratio value of 1.0 means that a school has the same percentage of low-income students as all of a district’s schools combined. A school with a ratio greater than 1.0 has a higher percentage of ED students than the district, while a ratio less than 1.0 means the school’s ED percentage is less than the district’s percentage.
We created two per-pupil spending ratios to compare to the calculated ED ratios for each school; a ratio for per-pupil state/local spending and a separate ratio for total spending. Similar to the ED ratio, a school with a spending ratio greater than 1.0 received a per-pupil spending allocation above the district average; a ratio of less than 1.0 applies to schools whose allocations were below the district average.
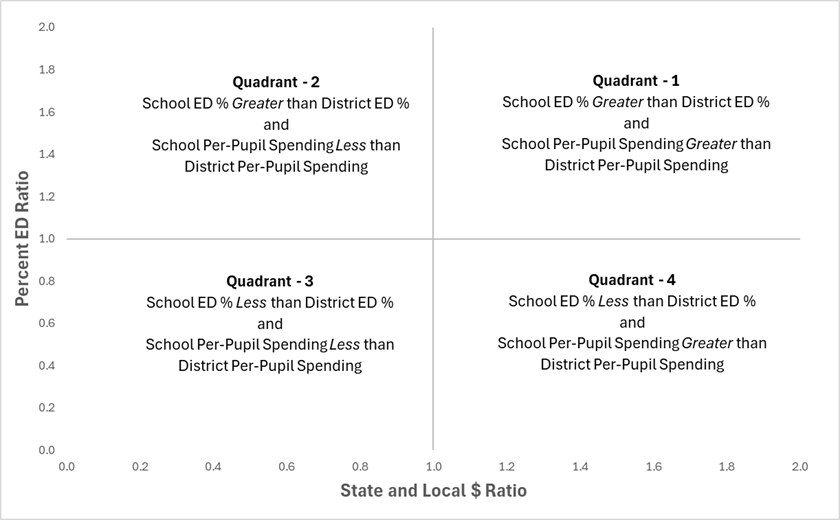
For each district of interest, we plot each school’s ED ratio against its per-pupil spending ratio on an X-Y scatter plot to show the correlation/relationship between school poverty and spending. Every school falls into one of four quadrants divided along the two axes with spending assigned to the X-axis and student poverty to the Y-axis (example below).
X-Y Scatter Plot – per-pupil state/local spending and school poverty
Source: Citizens Research Council of Michigan
Two of the quadrants (1 and 3) align with patterns of equitable resource allocation – districts that are providing more resources to their schools that enroll higher percentages of high-need students. Schools that fall into quadrant 1 have a higher percentage of ED students compared to the district overall and also experience relatively higher per-pupil spending. Conversely, schools appearing in quadrant 3 have a lower percentage of ED students compared to the district, and per-pupil spending is lower than the district overall.
School spending patterns for quadrants 2 and 4 are not aligned with what would be considered equitable resource allocation. For example, schools falling into quadrant 2 have relatively more higher-need ED students than their district’s overall but receive relatively fewer per-pupil resources. Similarly, schools appearing in quadrant 4 have fewer high-need ED students, but the per-pupil spending in those schools is greater than the district average.
Results and Discussion
We present the distribution of schools across these four quadrants for two subsets of Michigan school districts – the largest 25 districts and the 15 largest “high-poverty” districts. Because we created two spending ratios, we present the results for state/local per-pupil spending and another for total per-pupil spending.
Equitable School-Level Per-Pupil Spending Analysis: 25 Largest School Districts
| Quadrant | State/Local Spending (# of schools) | Total Spending (# of schools) | State/Local Spending (% of schools) | Total Spending (% of schools) |
| 1 | 145 | 159 | 26% | 29% |
| 2 | 171 | 157 | 31% | 28% |
| 3 | 157 | 157 | 28% | 28% |
| 4 | 80 | 80 | 14% | 14% |
| Total | 553 | 553 | 100% | 100% |
Overall, of the 553 schools examined, 302 schools (54 percent) exhibited equitable state/local spending patterns – these schools fall into either quadrant 1 or quadrant 3. The other 46 percent of schools exhibited inequitable spending patterns with the largest share of schools (31 percent) falling into quadrant 2, and the smallest share (14 percent) falling into quadrant 4.
Not surprisingly, when total per-pupil spending is examined, the total percentage of schools that experienced equitable spending increased to 57 percent among the largest 25 districts. This makes sense because the largest source of federal dollars that districts receive is through the Title I, Part A program, which is designed to help disadvantaged children meet high academic standards by participating in either a schoolwide or a targeted assistance program. With the federal funding added in, the largest share of schools (29 percent) fall into the equitable spending category (quadrant 1). Federal funding effectively shifts a handful of schools from the inequitable spending category (quadrant 2) to the equitable spending category.
Equitable School-Level Per-Pupil Spending Analysis: 15 Largest “High-Poverty” School Districts
| Quadrant | State/Local Spending (# of schools) | Total Spending (# of schools) | State/Local Spending (% of schools) | Total Spending (% of schools) |
| 1 | 80 | 88 | 24% | 27% |
| 2 | 133 | 125 | 40% | 38% |
| 3 | 79 | 82 | 24% | 25% |
| 4 | 39 | 36 | 12% | 11% |
| Total | 331 | 331 | 100% | 100% |
We found similar results when we examined spending patterns in the 15 largest “high-poverty” districts. Overall, less than one-half (48 percent) of schools from these districts show up in the equitable spending quadrants (1 and 3) in our analysis. A whopping 40 percent of schools from this subset of districts appear in quadrant 2 – schools in this category enroll a greater percentage of high-need ED students compared to their parent district overall, but receive relatively fewer state/local resources. Another 12 percent of schools appear in quadrant 4. This results in a total of 62 percent of “high-poverty” district schools exhibiting inequitable per-pupil spending patterns.
As we saw with the other subset of large districts, the inclusion of federal spending shifts more schools into the equitable spending pattern quadrants. Federal fund spending effectively increased the overall percentage of schools appearing in quadrants 1 and 3 from 48 percent to 52 percent.
Conclusion
Our novel analysis of school-level spending patterns across the largest districts in the state suggests that many schools are not being funded equitably. This is at odds with the current school funding policy priorities of Lansing officials. As Michigan policymakers look to continue providing additional state “at-risk” funds to those districts with greater proportions of high-need students, they may have to consider additional policy directives to ensure dollars targeted to high-need “at-risk” students are reaching those students and the schools they attend. To this end, Michigan may have to increase the financial transparency and accountability provisions that go along with the additional state “at-risk” dollars or other funding streams intended to serve students with added needs. Those provisions, combined with appropriate state oversight and monitoring, will help ensure that the state’s K-12 funding priorities are being implemented with fidelity at the local district level.
This report represents just the first of our planned analyses of the new school-level spending data. We will use the data to examine how the recent increases in state “at-risk” dollars change school-level allocations. Additional research will focus on the role that distinct-level budgeting practices play in school allocation decisions and other factors contributing to the results of our unique equitable spending analysis.
