October 29, 2024
In a nutshell
- State law requires the City of Detroit to forecast its revenues for five years as the initial step of the budgeting process.
- These forecasts have tended to underestimate city revenues, but have been reasonably accurate.
- In case the city overestimates revenues, state law additionally requires the city to hold money in a budget reserve.
In 2014, the State of Michigan, amended Public Act 279 of 1909, the Home Rule City Act, to ensure the City of Detroit’s continued financial health after bankruptcy. Of the multiple measures that affected the city’s financial operations and local fiscal policy, the law mandates that the city ritualistically forecast its revenues. City revenue projections have consistently underestimated revenues, thus preventing difficult mid-year budget cuts. A review of the city’s forecasting record shows both the discipline it has introduced and the relative accuracy of the projections.
Twice a year, in February and in September, the City of Detroit holds Revenue Estimating Conferences to establish an economic forecast and project city revenues for the current and future fiscal years. The five-year revenue projections are used to set the revenue bases for the city’s Adopted Budget, Four-Year Financial Plan, and 10-Year Pro Forma Forecast. Projections are prepared by the city’s Office of the Chief Financial Officer and reviewed by the conferees: city’s Chief Financial Officer, State Treasurer, and an independent university economist.
On February 13, 2023, the city held its 17th conference and released economic forecasts and revenue projections for Fiscal Year (FY)2023 through FY2027. As the city projects forward, this analysis looks backward to focus on how accurate past revenue estimates have proved to be.
The city has consistently underestimated how much money it will collect from taxes, state revenue sharing, and other sources. This bias toward underestimating revenues is, to some extent, to the city’s benefit. A bias toward underestimating revenues means it is less likely the city will overcommit resources and be forced to cut back when municipal income does not come in as expected.
While the bias toward underestimating revenue has remained consistent, the size of forecasting errors—the difference between projections and actual results—has grown since the onset of the COVID-19 pandemic. The February 2020 forecast, issued immediately before the pandemic disrupted economic life, projected total FY2020 General Fund revenue of $1.1 billion. The city collected $960.4 million, $116.5 million (12.1 percent) less than projected. The opposite occurred for FY2021. Having changed forecasting assumptions to cohere with a changing world, the city lowered expectations at its February 2021 conference, projecting $847.6 million in total General Fund revenue. Instead, the city collected $1 billion: $156.7 million (18.5 percent) more than projected.
More particular than total General Fund revenue, the Revenue Estimating Conferences have been more accurate in projecting some revenue sources than others. The city projects various taxes (income, wagering, property, utility users) and state revenue sharing to arrive at its total revenues. Combined, the data provide insight into the city’s forecasting record.
Forecasting accuracy
Envision a dartboard. The dartboard has a bullseye and the balance of the board has been divided into northern and southern halves with colored circles rippling out from the bullseye. Each revenue projection represents a dart thrown by the city.
In the tables below, positive values represent overestimates (the city missed the bullseye on the high side) and negative values represent underestimates (the city missed on the low side). The “direction” of the forecasting error, positive or negative, is the bias. Stripping away the direction of forecasting errors, and simply measuring how far off from the bullseye the city was is the variance. So, in the tables below, data on the city’s misses and the size of those misses are aggregated.
For comparing the revenue projections to actual collections two statistical measures are used. One is the mean error: the average of forecasting errors. The other is the mean absolute error: the average of forecasting errors without regard to direction.
The data in Table 1 shows that the city has had a tendency toward underestimating revenues and, generally, has been off by 6.6 percent. The table also shows that the city has been better at projecting some revenue sources than others. For instance, income tax revenue is difficult to estimate due to insufficient data. Employment and other data specific to the city can be difficult to obtain—let alone with the frequency and recency needed. Of the data that is available, those data are often collected at the county or regional level, including jurisdictions that have socioeconomic profiles that are considerably different from the city. Consequently, it can be difficult to discern how many people are working, and in what occupations—factors directly relevant to how much income will be earned by workers within the city and subject to tax.
Table 1
Comparing General Fund Revenue Projections to Actual Revenues, FY2016 to FY2022

For the following tables, data has been divided into two periods, before the pandemic and the period since its onset.
Table 2 shows that in the period before the pandemic—FY2016–FY2019—and Table 3 shows the performance of revenue projections during the COVID-19 pandemic: FY2020–FY2022.
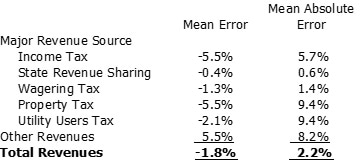
In the period before the pandemic—FY2016–FY2019—the city had a slight negative bias, and the average forecasting error was lower: 2.2 percent.
Table 2
Comparing General Fund Revenue Projections and Actual Results, FY2016 to FY2019
Of course, the pandemic introduced additional uncertainty to the process. It was not clear how the economic activities taxed by the city would be affected by the work-at-home trend and other disruptions.
Since the onset of the pandemic, the size of the city’s average forecasting error has nearly doubled. The average forecasting error for the period of FY2020 to FY2022 was 12.4 percent (see Table 3). Bigger average forecasting errors are identified for income tax and wagering tax specifically, 23.5 percent and 24.7 percent, respectively. The pandemic and the totality of its effects were unforeseen. Equally unpredictable was the federal largesse that followed—aid to state and local governments, businesses, and households—as was how effective that aid would be.
In its February 2020 forecast, the city projected income tax collections of $325.8 million, 13.7 percent more than what was collected. Switching its forecasting assumptions to that of economic malaise for the February 2021 forecast, the city projected income tax collections of $223 million. Between the February 2020 and February 2021 forecasts, the city lowered its expected income tax collections by $106.8 million or 32.4 percent. Yet, the city’s income tax collections in FY2021 amounted to $316 million. The city underestimated income tax revenue by 29.4 percent. This specific revenue source exemplifies the difficulty of forecasting during the pandemic. The city missed by 13.7 percent too high then missed by 29.4 percent, but too low.
Additionally, for wagering tax revenue, the mean error hides the very large miss in FY2020 when casinos were shuttered. It then missed on the low side when sports and internet gaming were authorized in Michigan.
Table 3
Comparing General Fund Revenue Projections and Actual Results, FY2020 to FY2022

FY2020, and the related Revenue Estimating Conferences, is the only period in the data reviewed where total General Fund revenue was overestimated by more than 1 percent.
The size of forecasting errors
The city will occasionally overestimate and underestimate revenues; the size of forecasting errors is what matters.
The city’s FY2023 Adopted Budget was made under the presumption that the city will collect $1.2 billion in General Fund revenue. If the city overestimated revenues by five percent, for example, that would equate to $61.2 million. For added context, between FY2007 and FY2008, the period of the Great Recession, General Fund revenue declined by 12.4 percent, or $184 million. Between FY2019 and FY2020, the period between normal economic times and the onset of a worldwide pandemic, General Fund revenue declined by 14.3 percent, or $159.9 million. Consequently, shortfalls in revenues forced the city to cutback expenditures. Fortunately for the city, the same law that mandates the city take a multi-year perspective on revenues requires that the city hold reserves of five percent of projected spending.
Based on the city’s most recent conference, the city’s budget reserve amounts to $138 million or 11.3 percent of General Fund expenditures as appropriated in the FY2023 Adopted Budget. These monies, in addition to other cash on hand, lessen the effect of forecasting errors. In other words, the city can afford to err—to a limited extent.
Conclusion
So as the effects of the COVID-19 pandemic moderate, so too will the city’s forecasting errors likely moderate. In a testament to how quickly the world can change, in FY2020 and FY2021, the pandemic was publicly presumed to be the greatest influence on economic outcomes and resultantly city revenues. Now, that conversation has changed to how actions taken by the Federal Reserve will affect the economy. In and out of the pandemic, the city has on average maintained a bias toward underestimating revenue—the preferable error to make. This analysis will be continually updated to measure whether that remains true.
